
18 Jul Revolutionary Model for Analyzing Proper Space Creation and Occupation in Professional Football
Introduction
In modern football, tactics and rational occupation of the field are key aspects for success. Spatial analysis, traditionally based on the Voronoi diagram, has allowed us to better understand how players control the pitch. However, the limitations of this approach, especially regarding the offside rule and differences in player speed and acceleration, require a more advanced model. In this post, we present an innovative methodology that incorporates these factors, redefining how we evaluate space creation and field occupation.
Limitations of the Traditional Voronoi Model
The traditional Voronoi model has two main limitations:
- Offside Rule: It does not consider the ineffective spaces generated by the offside rule.
- Homogeneity in Speed and Acceleration: It assumes that all players have the same maximum speed and acceleration, which does not reflect the reality of football.
Our Improved Model
To overcome these limitations, our model introduces two key innovations:
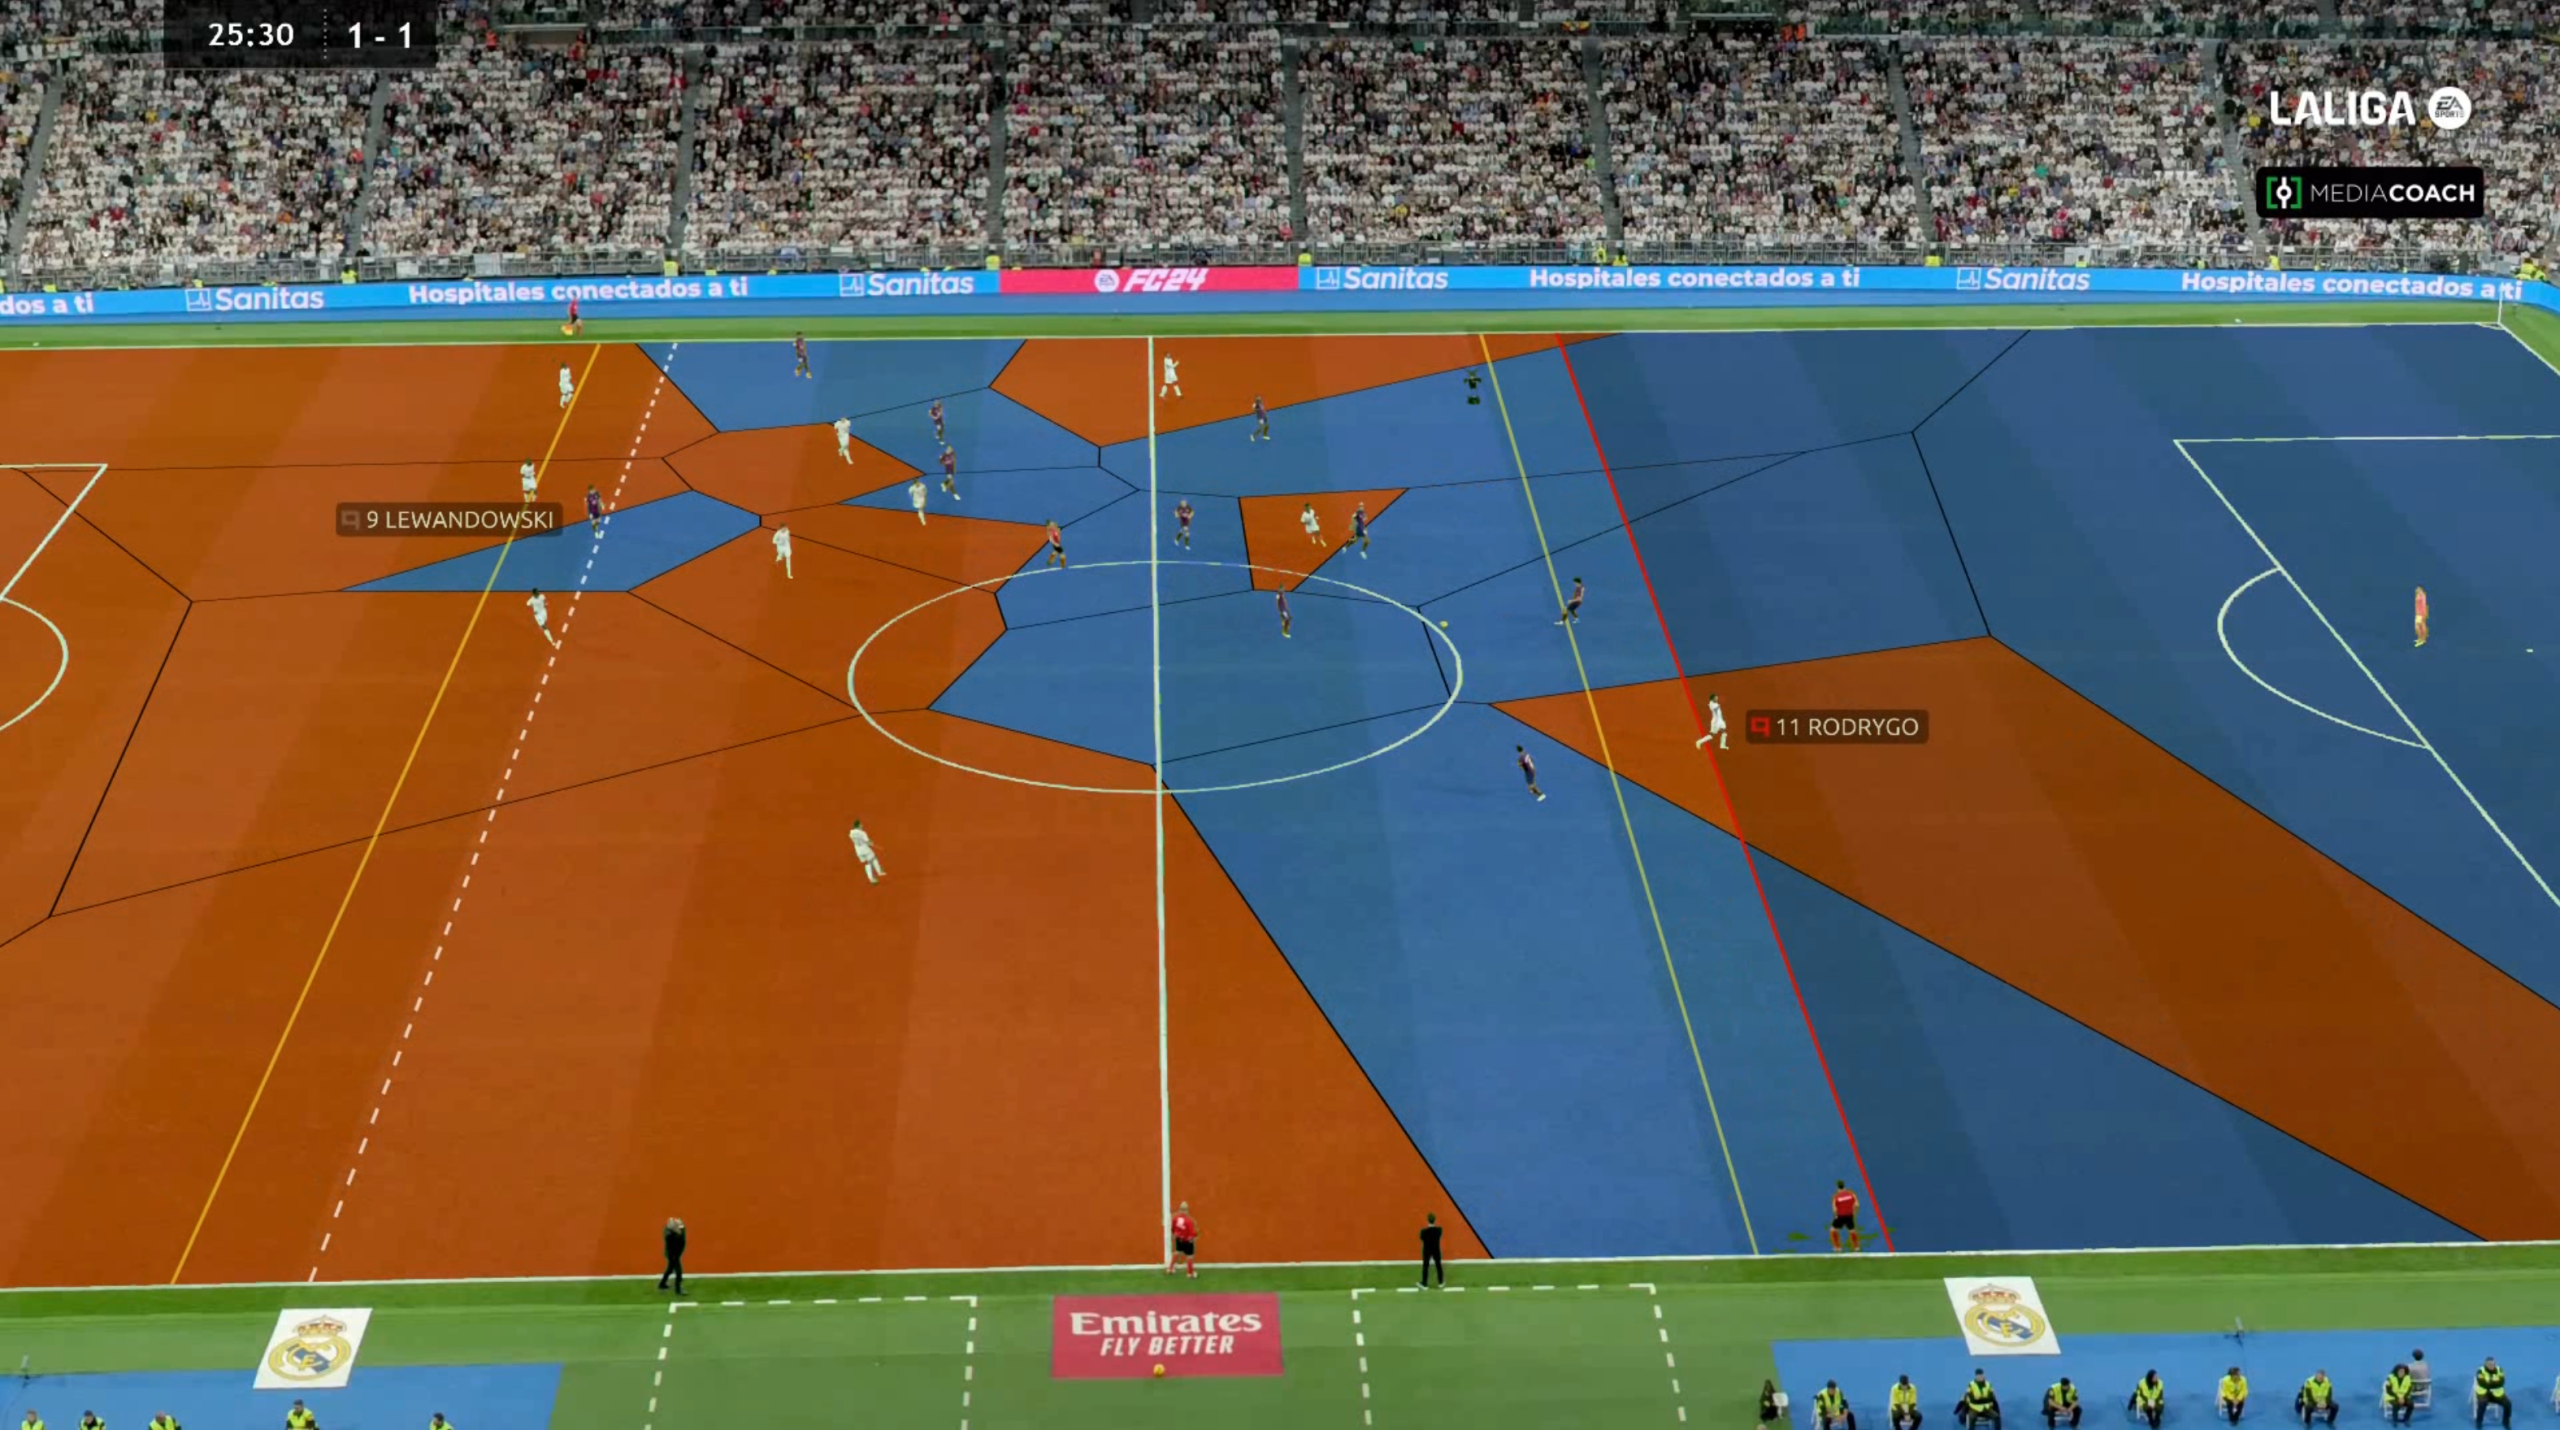
- Ineffective Spaces and Offside: We incorporate the offside rule into spatial analysis, distinguishing between effective and ineffective spaces.
- Individual Speed and Acceleration: We adjust each player’s Voronoi areas based on their historical maximum speed and acceleration values, as well as those of nearby players.
Practical Application and Results
This advanced model allows us to more accurately analyze how players occupy the field. Players with higher speed and acceleration can control larger areas, translating into significant tactical advantages.
Top 10 Players with the Greatest Potential for Voronoi Area Occupation
Top 10 Players by Average Maximum Sprint Speed
| Rank | Player | Team | Maximum Speed (Km/h) |
|---|---|---|---|
| 1 | MARVIN | UD LAS PALMAS | 26.29 |
| 2 | BECKER | REAL SOCIEDAD | 26.07 |
| 3 | L. SUAREZ | UD ALMERIA | 25.93 |
| 4 | ALVARO | RAYO VALLECANO | 25.92 |
| 5 | EZ ABDE | REAL BETIS | 25.91 |
| 6 | RAMAZANI | UD ALMERIA | 25.88 |
| 7 | J.ARAUJO | UD LAS PALMAS | 25.87 |
| 8 | A. REBBACH | D. ALAVES | 25.72 |
| 9 | FRAN GARCIA | REAL MADRID | 25.66 |
| 10 | GIULIANO | D. ALAVES | 25.65 |
Top 10 Players by Maximum Acceleration
| Rank | Player | Team | Maximum Acceleration (m/s²) |
|---|---|---|---|
| 1 | MENDES | UD ALMERIA | 5.07 |
| 2 | CARLOS FDEZ | REAL SOCIEDAD | 5.03 |
| 3 | MURIQI | RCD MALLORCA | 5.00 |
| 4 | GURUZETA | ATHLETIC CLUB | 4.96 |
| 5 | DIEGO LOPEZ | VALENCIA CF | 4.92 |
| 6 | ALVARO | RAYO VALLECANO | 4.86 |
| 7 | STRAND LARSEN | RC CELTA | 4.85 |
| 8 | B. MAYORAL | GETAFE CF | 4.82 |
| 9 | YEREMY | VILLARREAL CF | 4.79 |
| 10 | BALLIU | RAYO VALLECANO | 4.75 |
Conclusion
Our innovative approach not only improves tactical visualization and analysis but also provides a solid foundation for making informed strategic decisions. Incorporating the offside rule and individual physical characteristics of players into spatial analysis redefines how we understand and optimize field occupation in football.