
07 Ago How to Evaluate Tactical-Technical Intensity in Football Through Maximum Acceleration

Introduction
In modern football, the intensity of the game has become a critical factor for success on the field. A team’s ability to maintain high levels of intensity, both in offensive and defensive phases, can make the difference between winning and losing a match. But how can we objectively measure this intensity? In this article, we explore how maximum acceleration, an objective physical parameter, can be used to analyze the intensity of players in different phases of the game.
Method and Analysis
For this analysis, we used maximum acceleration data from players in various positions over a season. The accelerations were divided into several offensive and defensive sub-phases, and average values were calculated for each position.
Offensive Phases:
- Build-up
- Counterattack
- Finishing
- Progression
Defensive Phases:
- Defensive Block Change
- Transition ATT to DEF
- Transition DEF to ATT
- Opponent Build-up
- Opponent Counterattack
- Opponent Finishing
- Opponent Progression
Results
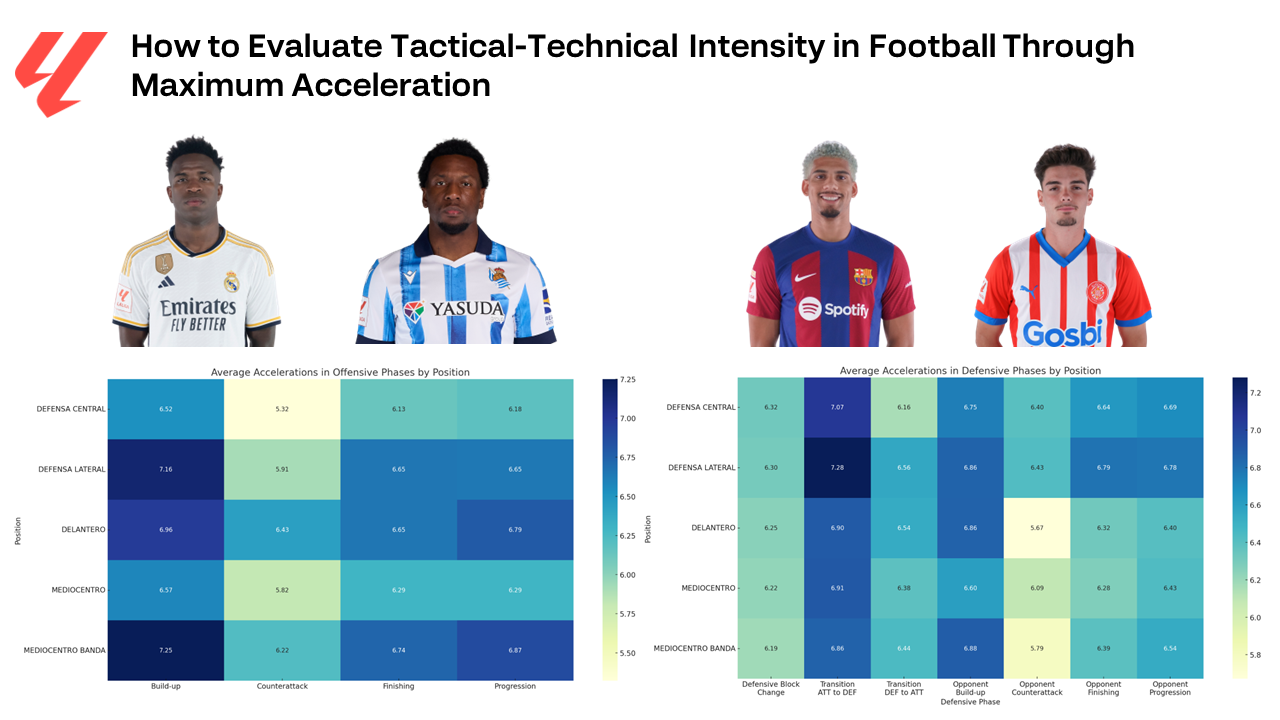
Using the average maximum acceleration values, we created a visual guide for coaches, highlighting the positions that show the greatest intensity in each game sub-phase.
Offensive Phase
| POSITION | Build-up | Counterattack | Finishing | Progression |
|---|---|---|---|---|
| CENTRAL DEFENDER | 6.52 | 5.32 | 6.13 | 6.18 |
| FULLBACK | 7.16 | 5.91 | 6.65 | 6.65 |
| FORWARD | 6.96 | 6.43 | 6.65 | 6.79 |
| MIDFIELDER | 6.57 | 5.82 | 6.29 | 6.29 |
| WINGER | 7.25 | 6.22 | 6.74 | 6.87 |
Defensive Phase
| POSITION | Defensive Block Change | Transition ATT to DEF | Transition DEF to ATT | Opponent Build-up | Opponent Counterattack | Opponent Finishing | Opponent Progression |
|---|---|---|---|---|---|---|---|
| CENTRAL DEFENDER | 6.32 | 7.07 | 6.16 | 6.75 | 6.40 | 6.64 | 6.69 |
| FULLBACK | 6.30 | 7.28 | 6.56 | 6.86 | 6.43 | 6.79 | 6.78 |
| FORWARD | 6.25 | 6.90 | 6.54 | 6.86 | 5.67 | 6.32 | 6.40 |
| MIDFIELDER | 6.22 | 6.91 | 6.38 | 6.60 | 6.09 | 6.28 | 6.43 |
| WINGER | 6.19 | 6.86 | 6.44 | 6.88 | 5.79 | 6.39 | 6.54 |
Interpretation of Results
Each position on the field has tactical responsibilities reflected in their levels of intensity in different phases of the game. Fullbacks and wingers, for example, show high acceleration values in both offensive and defensive phases, reflecting their integral role in both aspects of the game. Forwards particularly stand out in counterattack and offensive progression, while central defenders show higher intensity in the defensive transition phase.
To determine if the differences in acceleration between positions are statistically significant, we conducted an Analysis of Variance (ANOVA) for each sub-phase. Here are the cases where the differences were statistically significant:
Statistically Significant Differences
- Offensive Phases:
- Build-up: Differences between positions were significant (F = 13.747, p < 0.0001).
- Counterattack: Differences between positions were significant (F = 15.134, p < 0.0001).
- Finishing: Differences between positions were significant (F = 12.048, p < 0.0001).
- Progression: Differences between positions were significant (F = 14.132, p < 0.0001).
- Defensive Phases:
- Opponent Build-up: Differences between positions were significant (F = 2.926, p = 0.021).
- Opponent Counterattack: Differences between positions were significant (F = 16.821, p < 0.0001).
- Opponent Finishing: Differences between positions were significant (F = 7.654, p < 0.0001).
- Opponent Progression: Differences between positions were significant (F = 3.942, p = 0.004).
Methodology for Statistical Analysis
The Analysis of Variance (ANOVA) is a statistical method used to compare the means of three or more groups to see if there is a significant difference between them. In this analysis, we used ANOVA to compare the average maximum accelerations across different positions for each sub-phase of the game. A low p-value (typically less than 0.05) indicates that there are significant differences between the groups.
Practical Application
For coaches and physical trainers, this data can be extremely valuable. Using maximum acceleration as an objective metric allows for real-time evaluation and adjustment of player intensity. Ideally, this analysis should be conducted post-match, allowing for a detailed review of player performance and identification of areas for improvement.
Analysis Limitations
It is important to note that this analysis is based on accumulated data over a full season. Intensity in a single match can vary significantly due to factors such as team strategy, opponent, and match conditions. Therefore, to obtain an accurate assessment of intensity, it is recommended to perform this analysis post-match.
Conclusion
Maximum acceleration is an objective physical parameter that can provide a detailed view of player intensity in different phases of the game. By using this metric, coaches can make informed decisions to improve the tactical and physical performance of their team, ensuring they maintain high levels of intensity at all times.
This approach not only brings a new level of scientific rigor to football analysis but also offers a practical tool to enhance on-field performance.
Visualization
Here is a visual guide with average acceleration values by position in each game phase:
Average Accelerations in Offensive Phases by Position
Average Accelerations in Defensive Phases by Position
This guide can be used by coaches and physical trainers to adjust training programs and game strategies, ensuring players maintain the appropriate intensity in each phase of the game.
