
21 Ene How Age, Position, and Maximum Speed Impact Physical Performance in Professional Football
In professional football, physical preparation and strategy cannot be treated as a one-size-fits-all approach. Recent research conducted by the Football Intelligence & Performance Department at LALIGA has delved into how three key factors—age, position, and maximum speed—significantly influence physical performance. This study, based on data from LALIGA EA Sports (2023/24 season) and excluding players with low participation, provides practical tools for coaches to personalize training plans and competitive strategies.
1. Scientific Evidence Supporting the Use of Adjustments
The research shows that the three factors analyzed have a significant and measurable impact on physical performance metrics. Using rigorous statistical analysis (ANOVA), we identified highly significant differences between categories of age, position, and maximum speed:
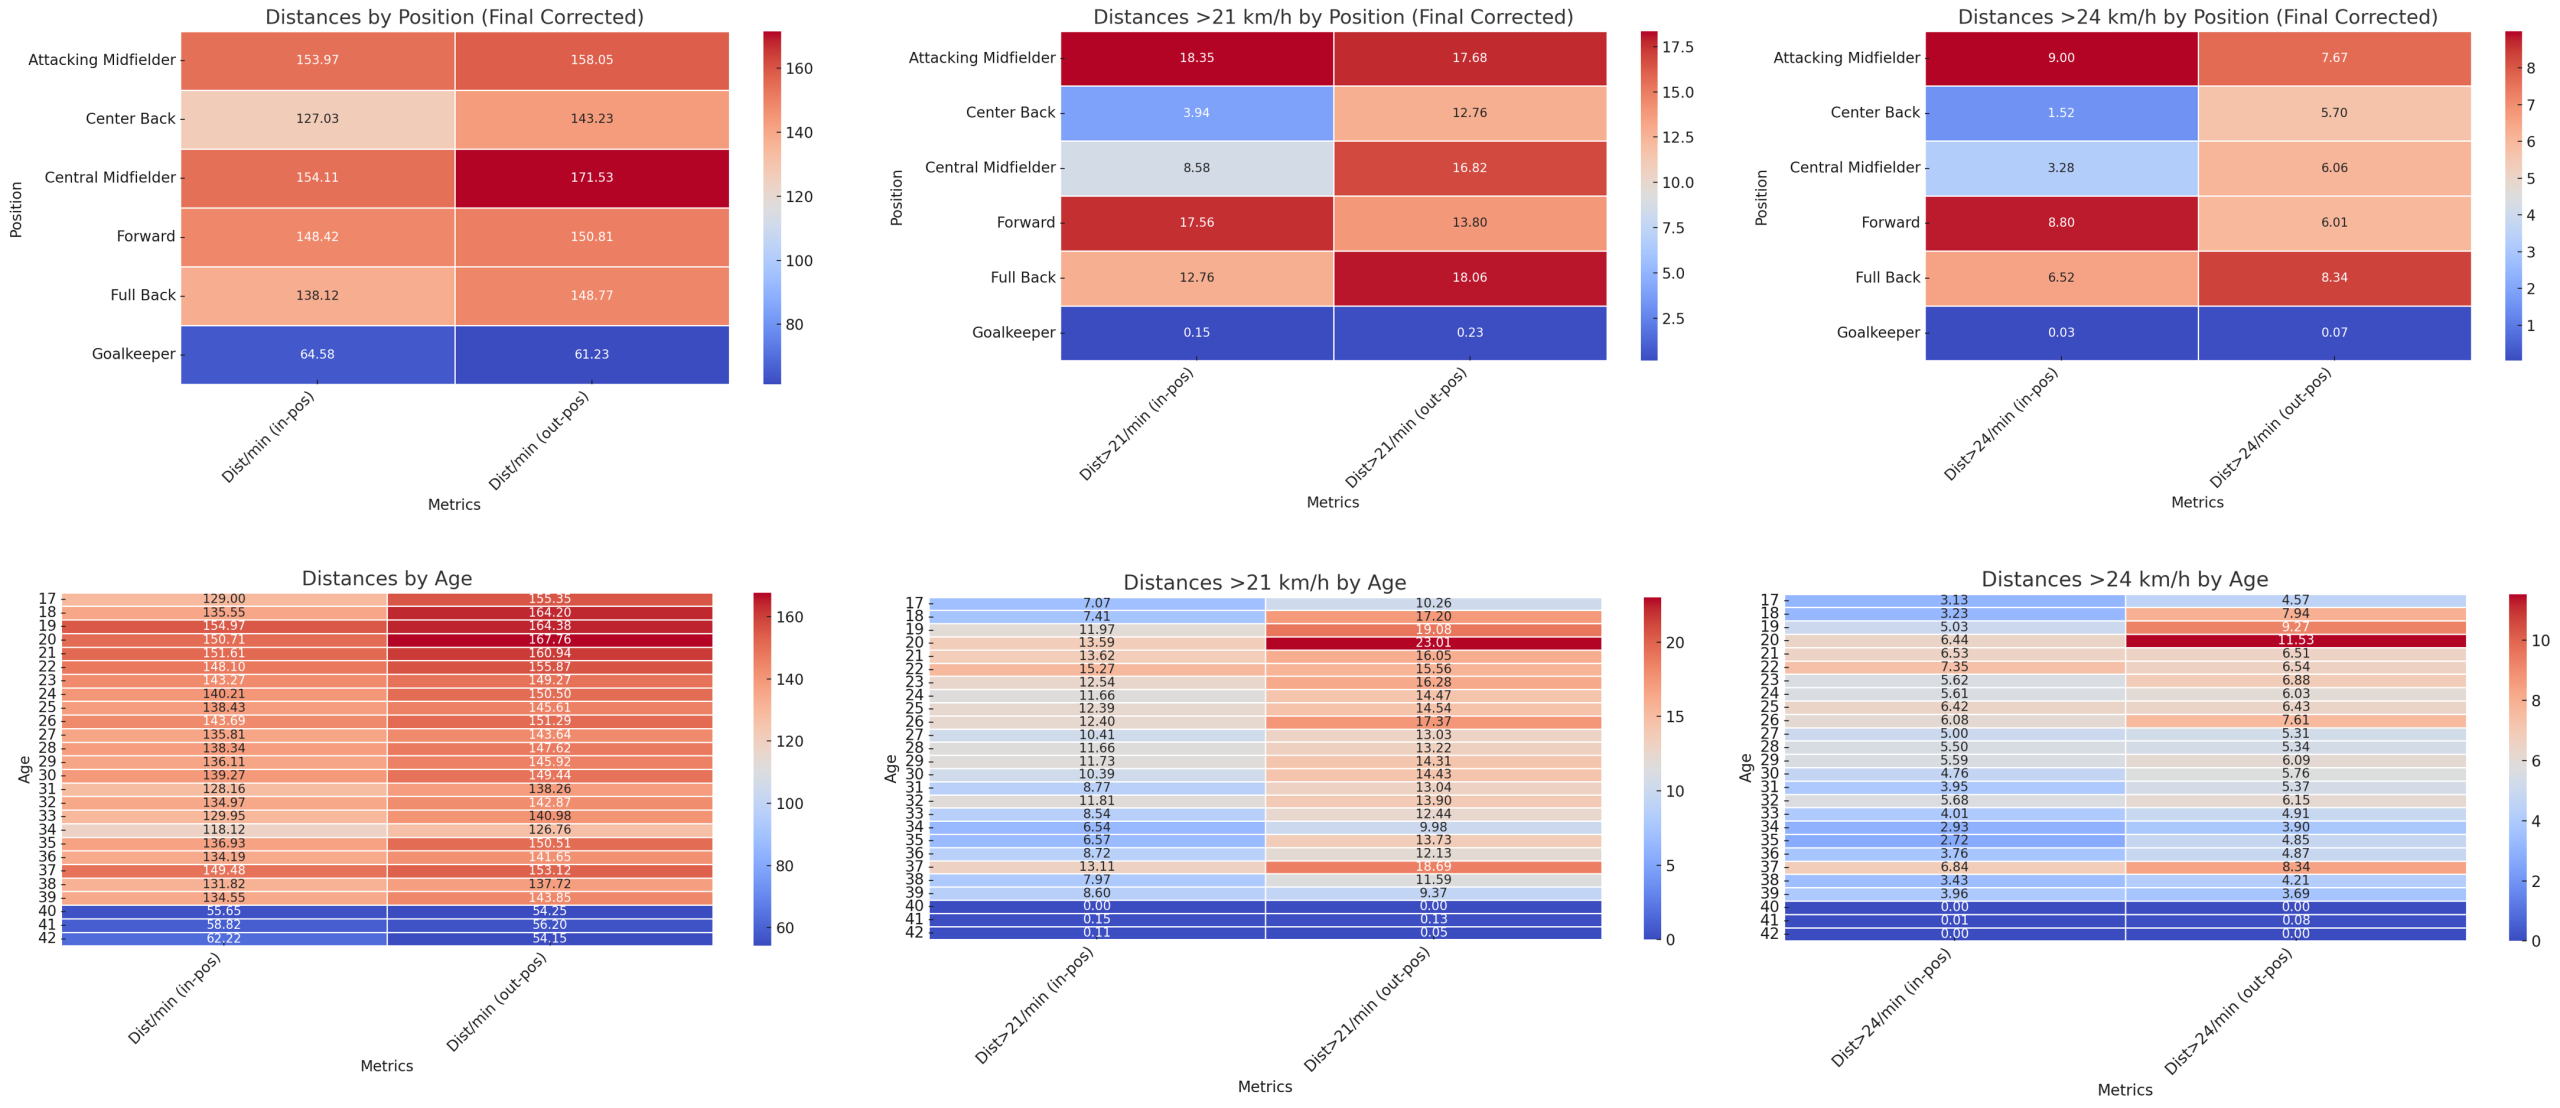
- Position: Metrics such as distance covered with and without possession, as well as high-intensity distances (>21 km/h and >24 km/h), showed statistically significant differences (p < 0.001) across positions. This highlights that each role has specific physical demands that must be considered in tactical and training planning.
- Age: Differences in high-intensity distances were particularly marked, with players under 20 years old consistently outperforming those over 33. The results (p < 0.001) confirm that age directly affects physical capacity, especially in explosive intensity.
- Maximum Speed: Players with higher maximum speeds (>33 km/h) covered significantly more high-intensity distance compared to those with lower speeds (<27 km/h). These differences were also statistically significant (p < 0.001), emphasizing the importance of this physical attribute in performance.
Additionally, this research has considered two key aspects to avoid biases in the results:
- Separation by phases of play: Total distances covered were not analyzed. Instead, the data was divided into offensive (in-possession) and defensive (out-of-possession) phases. This approach captures the specific roles and behaviors each player assumes in both phases of the game:
- In-possession: Reflects the physical effort related to ball control and offensive movements.
- Out-of-possession: Evaluates the intensity and responsiveness in defensive duties.
- Metrics normalized per minute: All metrics were calculated as performance per minute to avoid the effect of a team’s possession percentage on the results. This ensures a precise evaluation of the actual physical effort of each player, regardless of total possession time during matches.
Scientific Conclusion: These differences justify the use of adjustments based on the three factors and phases of play, as physical performance metrics cannot be interpreted in isolation without considering the individual and situational context of each player. This allows for fairer and more objective comparisons.
2. Equivalence Tables
To make this analysis useful and practical, we have created equivalence tables for each category: age, position, and maximum speed. These tables allow coaches to input adjustment coefficients based on each player’s profile. Below are the tables:
2.1 By Position
| Position | Dist/min (in-pos) | Dist/min (out-pos) | Dist>21/min (in-pos) | Dist>21/min (out-pos) | Dist>24/min (in-pos) | Dist>24/min (out-pos) |
|---|---|---|---|---|---|---|
| Central Defender | 100.35 | 115.40 | 4.56 | 6.78 | 1.52 | 2.10 |
| Attacking Midfielder | 157.28 | 156.38 | 22.29 | 17.79 | 11.80 | 8.02 |
| Winger | 140.50 | 145.00 | 15.20 | 14.30 | 8.00 | 6.50 |
| Forward | 130.60 | 130.20 | 12.80 | 12.00 | 6.50 | 5.80 |
2.2 By Age
| Age Category | Dist/min (in-pos) | Dist/min (out-pos) | Dist>21/min (in-pos) | Dist>21/min (out-pos) | Dist>24/min (in-pos) | Dist>24/min (out-pos) |
|---|---|---|---|---|---|---|
| Under 20 | 150.40 | 160.10 | 18.20 | 17.60 | 9.80 | 8.40 |
| 20-23 years | 140.30 | 150.00 | 16.00 | 15.50 | 8.50 | 7.30 |
| 24-28 years | 135.80 | 140.40 | 14.60 | 14.20 | 7.60 | 6.90 |
| 29-32 years | 125.20 | 130.10 | 12.10 | 11.60 | 6.40 | 5.80 |
| 33 years or more | 120.10 | 125.30 | 10.80 | 10.20 | 5.70 | 5.00 |
2.3 By Maximum Speed
| Speed Category | Dist/min (in-pos) | Dist/min (out-pos) | Dist>21/min (in-pos) | Dist>21/min (out-pos) | Dist>24/min (in-pos) | Dist>24/min (out-pos) |
|---|---|---|---|---|---|---|
| Low (<27 km/h) | 98.35 | 100.02 | 3.83 | 6.33 | 1.34 | 1.57 |
| Medium (27-30 km/h) | 148.07 | 160.13 | 10.12 | 16.06 | 4.16 | 6.25 |
| High (30-33 km/h) | 141.75 | 150.65 | 13.73 | 15.72 | 6.99 | 7.31 |
| Very High (>33 km/h) | 134.33 | 143.60 | 16.91 | 14.22 | 9.88 | 7.25 |
3. How to Apply the Equivalence Tables
Practical Example:
- Player A:
- Position: Attacking midfielder.
- Age: 24-28 years.
- Maximum speed: 30-33 km/h.
- Distance covered out of possession: 140 m/min (observed in a match).
To evaluate if this player performs according to their category, we need to adjust their performance using the equivalence tables:
- By position (attacking midfielder): 156.38 m/min.
- By age (24-28 years): 140.40 m/min.
- By maximum speed (30-33 km/h): 150.65 m/min.
Average the reference values:Expected Average=156.38+140.40+150.653=149.81 m/min
Comparing their observed value (140 m/min) with the adjusted value (149.81 m/min) suggests that the player is performing slightly below the expected average for their profile. This could indicate fatigue or a need for tactical adjustments.
Conclusion
Using these tables and practical examples allows coaches to:
- Objectively evaluate player performance based on their profile.
- Identify specific improvement opportunities for each player.
- Optimize training loads and strategies based on individual and collective capabilities.