
24 Oct Automatic Detection of Defensive Inferiority: A Tracking-Based Proximity Network Model
Turning spatial structure into objective alerts — frame by frame.
When a defensive line stretches five extra meters, the signal is subtle, then decisive: one defender becomes outnumbered locally, a passing lane opens, and the overload bites. This model turns that moment into data. It transforms raw tracking into automatic alerts of defensive numerical inferiority, and – in the same logic – pinpoints where the opponent creates offensive superiority.
Developed from peer-reviewed research and implemented by the Football Intelligence & Performance Department at LALIGA, the approach converts proximity, geometry, and persistence into actionable video outputs – without relying on passes, shots or manual tagging.
Introduction — From Events to Space
Traditional analytics revolve around discrete events. Yet football’s hidden logic is spatial: who is close to whom, how far, and for how long. The research by Buldú et al. (Football Tracking Networks: Beyond Event-Based Connectivity, arXiv:2011.06014) reframed the problem using Signed Proximity Networks (SPN): connect players who are within a tactical distance threshold and analyze the evolving geometry.
Full text available at:
https://arxiv.org/pdf/2011.06014.pdf
This paradigm makes local overloads and underloads measurable. It replaces qualitative impressions of «being outnumbered» with a geometric criterion that can be audited across matches, zones and phases.
Methods — A Proximity Network That Triggers Alerts
Data: Optical tracking at 25 Hz (TRACAB).
Graph construction (SPN):
- Nodes: All on-field players.
- Edges: Between any two players < R meters apart (typically 6–8 m in mid-block; lower in low block; higher in high press).
- Edge sign: Positive for teammates (structural cohesion), negative for opponents (direct contention).
Defensive-inferiority alert (operational rule):
For a defending player D within a 30 m ball-centered radius, an alert triggers if, for ≥ 0.5 s:
- Number of opponents within R ≥ 2, and
- Number of teammates within R = 0 (excluding D).
Robustness filters (to avoid collinearity noise): minimum triangle area for D–O1–O2; angular spread at D between 40°–140°.
Phase & zone labeling:
- Phase detection: Based on possession and block dynamics (offensive/defensive).
- Zonal tagging: Via pitch grid (e.g., «Right channel – Zone 3»).
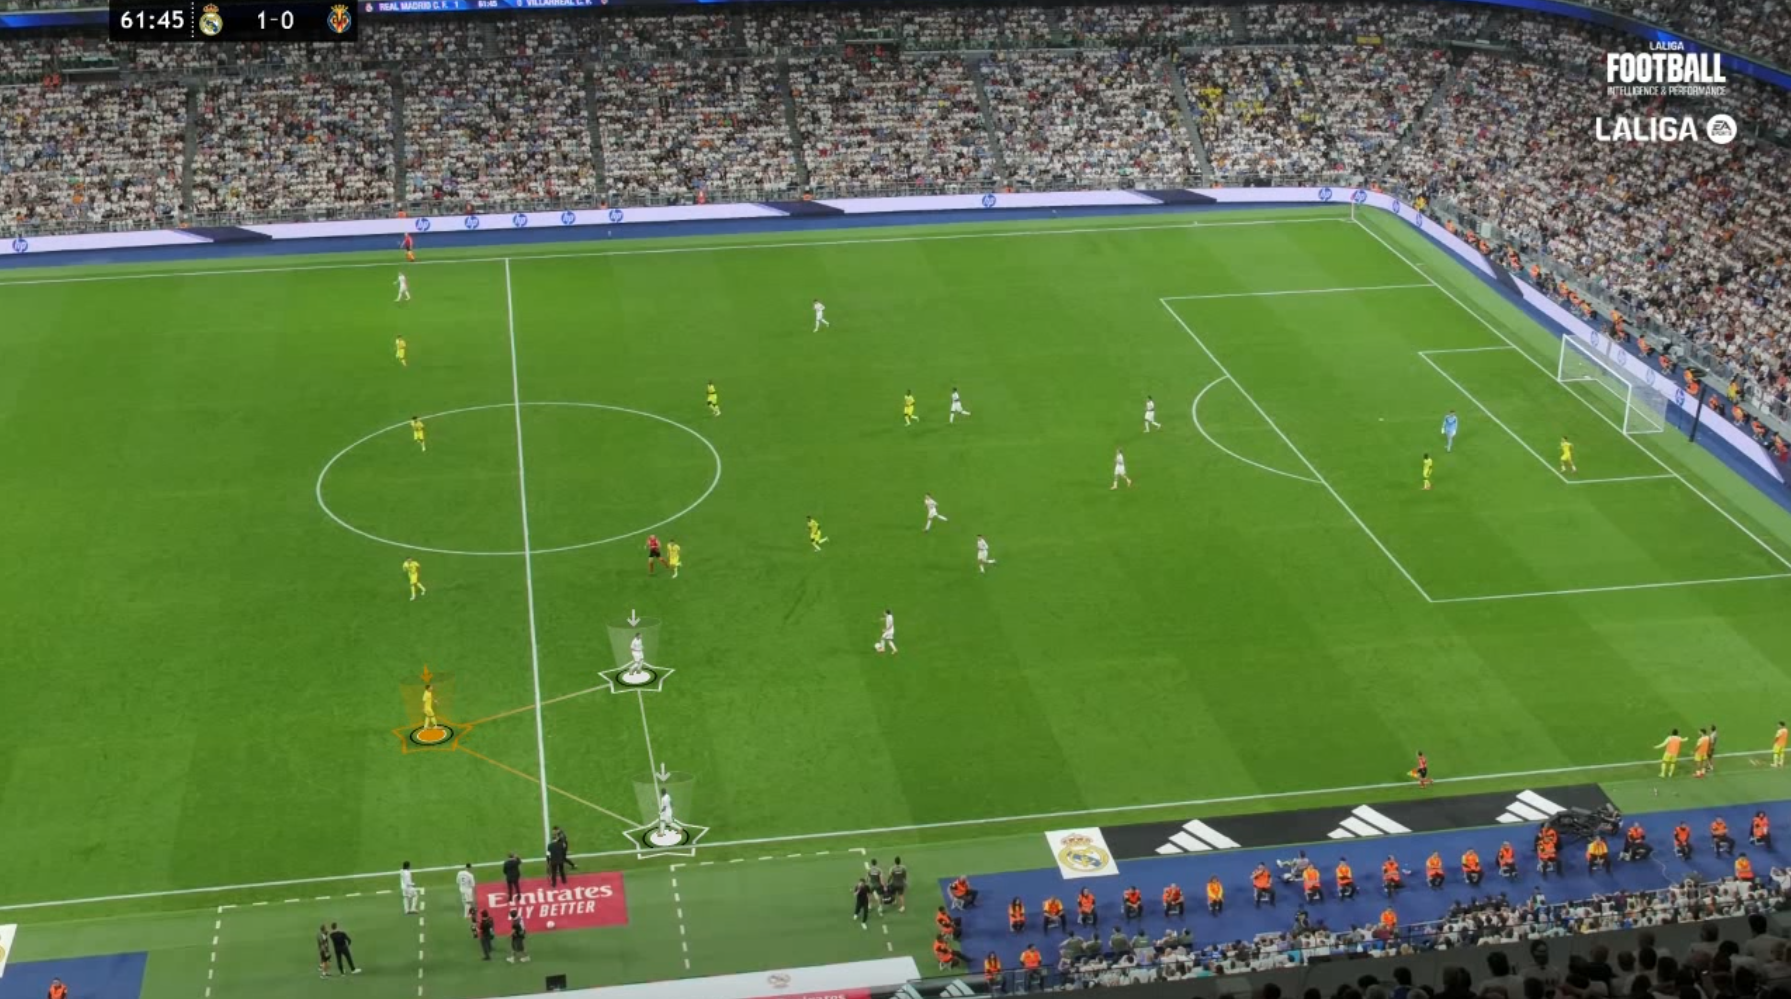
Outputs:
- Auto-generated video clips with overlay (IDs, proximity links, highlighted triangular area of exposure).
- Frequency/heat maps by zone and phase, with duration and repetition metrics.
Results — What the Model Reveals
1) Repeatable exposure patterns
Defensive underloads concentrate in predictable contexts: far-side switches (full-back lanes), early interior jumps (half-space gaps), and delayed cover across the last line. The model quantifies where, how often, and for how long these occur.
2) Compactness signature
Consistent with Buldú et al., teams showing average teammate distances around 6–8 m maintain more stable positive (green) proximity structures and reduce isolated 1v2 events — an empirical footprint of compactness that aligns with the broader literature on pitch control and spatial dominance.
3) Inverted logic for offensive superiority
Using the same geometry, the system flags where an opponent creates local 2v1s in attack (e.g., 3-2-5 rest-defence exploitation, wide overloads with full-back + winger + interior). These moments are enumerated and clipped automatically.
Conclusions — From Spatial Signal to Operational Intelligence
This tracking-based SPN model turns spatial relations into auditable structure: it exposes when and where defensive inferiority emerges and, symmetrically, where offensive superiority is constructed. Implemented by the Football Intelligence & Performance Department at LALIGA, it replaces manual search with objective alerts, preserves methodological transparency, and scales across matches for opponent analysis.
The innovation is not a new metric for its own sake; it is a robust way to treat the pitch as a dynamic network, where geometry and time define vulnerability – and where evidence replaces narrative.
Methodological Notes (Transparency)
- Sampling: 25 Hz tracking (TRACAB) validated in LALIGA environments.
- Thresholds: R tuned by phase (indicative mid-block 6–8 m); persistence ≥ 0.5 s.
- Scope: Alerts within ≤ 30 m of the ball; goalkeeper excluded except in box-specific rules.
- Caveat: The model surfaces structure, not causality; outcomes are reported separately (e.g., progression, shot creation) if required by the workflow.
Context within Football Science
This work extends a research line moving beyond events to the topology of space – from pitch-control models to proximity-based coordination and relative-phase analyses. SPN contributes a local, geometry-first lens that complements global control metrics: it identifies the moment structural support fails or accumulates, which is precisely where advantage changes hands.
Scientific article: Buldú, J. M. et al. (2020). Football Tracking Networks: Beyond Event-Based Connectivity. Full text available at https://arxiv.org/pdf/2011.06014.pdf