


05 May 1 in every 3 goals in open play in LALIGA comes from a cross into the box




A data-driven analysis of 8,830 crosses reveals what really determines success: box occupation, density, and individual execution.
1 in every 3 goals in open play in LALIGA EA Sports 2024/25 originates from a cross into the box.
However, despite their relevance, most crosses do not even lead to a shot.
So the key question for coaches and analysts is clear: what actually makes a cross effective?
Using data from 8,830 open play crosses, this analysis breaks down the anatomy of crossing by separating what drives shot creation from what determines goal scoring.
Dataset overview
The dataset includes all open play crosses in LALIGA EA Sports 2024/25:
- Total crosses: 8,830
- Crosses leading to a shot: 2,028 (23.0%)
- Crosses leading to a goal: 224 (2.54%)
When isolating open play goals (excluding set pieces), crosses account for approximately 32% of total goals.
This confirms that crossing is not a marginal action, but one of the main attacking mechanisms in modern football.
The build-up does not explain success
A first assumption could be that better crosses come from longer or more elaborate sequences.
The data does not support this idea.
| Variable | No Goal | Goal |
|---|---|---|
| Passes in sequence | 4.08 | 4.06 |
| Time of play (minutes) | 25,6 | 28,5 |
There are no meaningful differences in the number of passes or the structure of the possession.
Crossing success is not determined by how the attack is built.
Box occupation: a moderate effect
When looking at the number of attacking players inside the box, a pattern begins to emerge.
| Teammates in box | Goal % |
|---|---|
| 0–1 | 2.49% |
| 2–3 | 2.07% |
| 4+ | 3.38% |
The relationship is statistically significant (p = 0.007), but the effect size is moderate.
More players in the box increase the probability of scoring, but they do not guarantee success.
Density: the key to understanding crossing
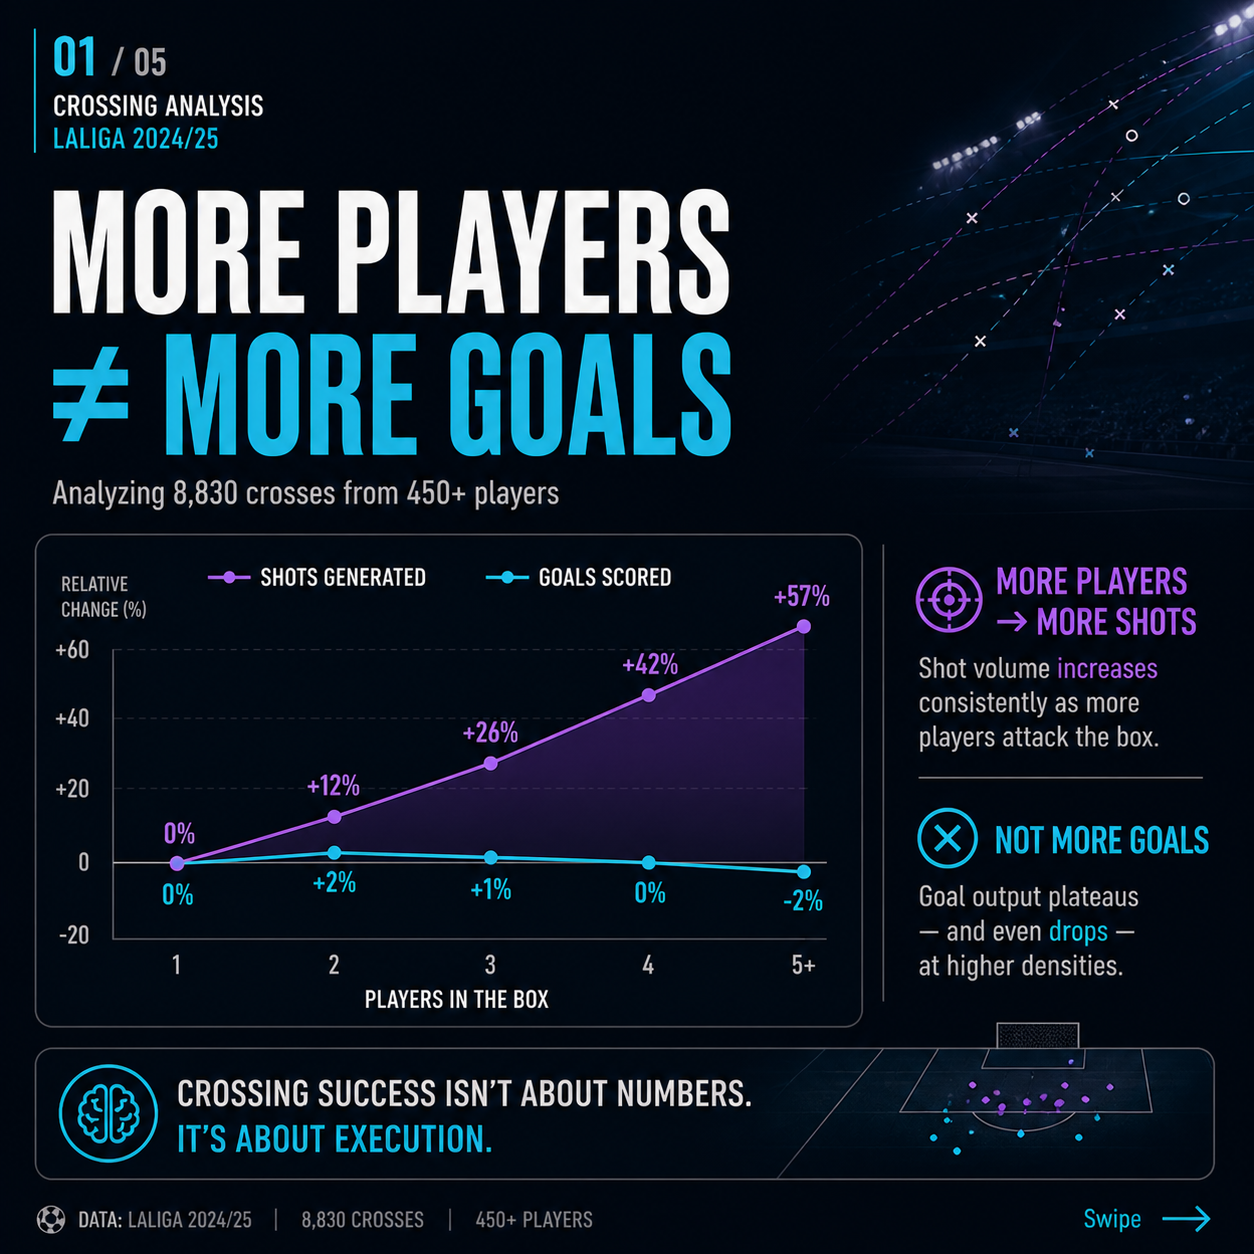
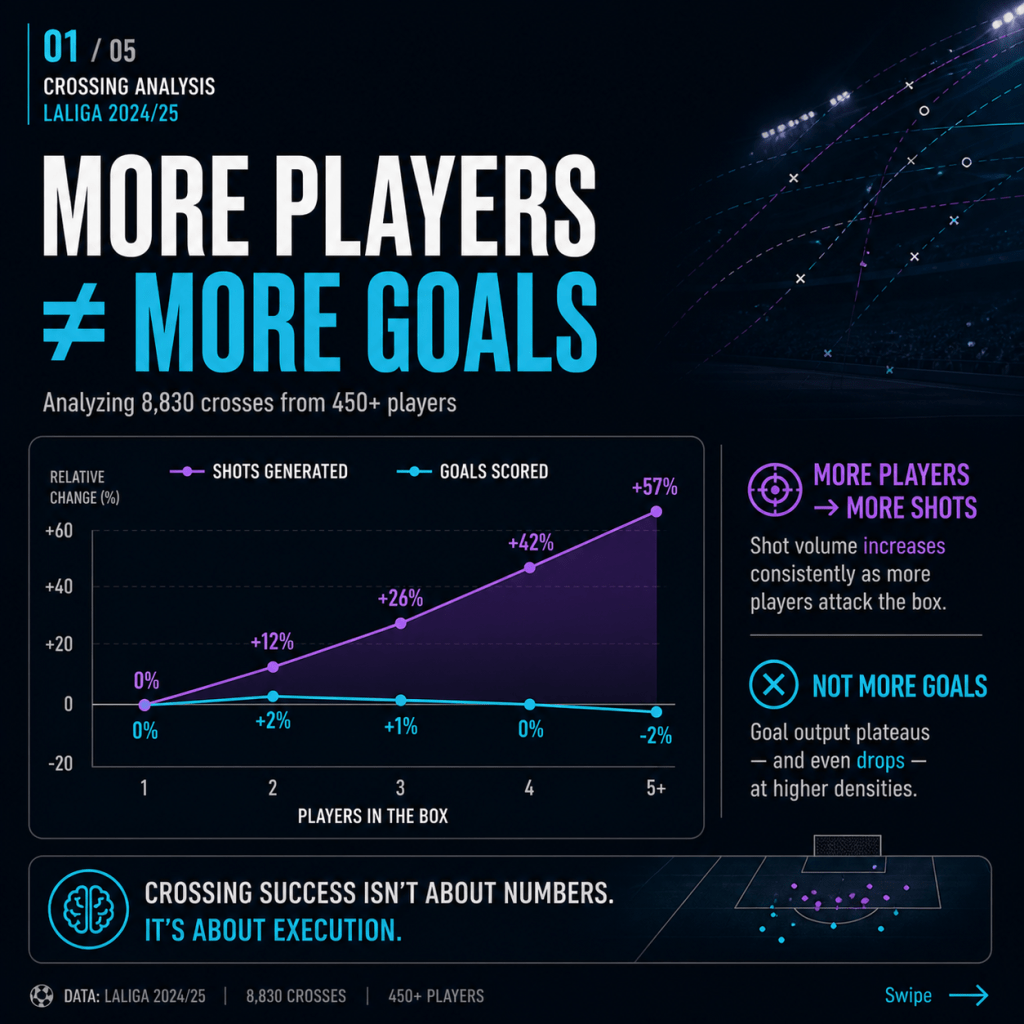
A more revealing variable is total density in the box, combining both attackers and defenders.
| Total players in box | Shot % | Goal % |
|---|---|---|
| ≤4 | 17.7% | 2.85% |
| 5–6 | 18.9% | 1.58% |
| 7–8 | 22.0% | 2.37% |
| 9+ | 29.6% | 2.96% |
Two important patterns emerge:
- Higher density clearly increases the probability of generating a shot
- It does not increase goal probability in the same way
The most inefficient scenario appears in medium-density situations (5–6 players).
From shot to goal: a different reality
When isolating only crosses that result in a shot, a new pattern appears.
| Density | Conversion (Goal %) |
|---|---|
| ≤4 | 15.0% |
| 5–6 | 8.4% |
| 7–8 | 10.3% |
| 9+ | 9.4% |
Lower density leads to higher efficiency.
Higher density leads to more volume but lower conversion.
This allows us to separate two distinct phases:
- Generating the shot → driven by density and occupation
- Converting the shot → driven by execution and space
The role of the crosser
Not all crosses are equal, and not all players generate the same outcomes.
Top 5 players (goals from crosses)
| Player | Crosses | Goals | Goal % |
|---|---|---|---|
| S. Cardona | 110 | 10 | 9.1% |
| Alex B. | 95 | 7 | 7.4% |
| Bryan | 149 | 7 | 4.7% |
| O. Mingueza | 100 | 6 | 6.0% |
| Rico | 127 | 5 | 3.9% |
League average: 2.5%
Some players triple the average efficiency.
Top teams (goals from crosses)
| Team | Crosses | Goals | Goal % |
|---|---|---|---|
| Villarreal CF | 495 | 25 | 5.05% |
| FC Barcelona | 509 | 18 | 3.54% |
| Atlético de Madrid | 515 | 18 | 3.50% |
| Girona FC | 613 | 18 | 2.94% |
| Getafe CF | 496 | 15 | 3.02% |
There is a moderate correlation between players in the box and goals (r = 0.56), but it is not decisive.
Intra-team concentration
Another key finding is how goals from crosses are distributed within teams.
Share of goals generated by Top 3 players
| Team | Top 3 Share |
|---|---|
| Getafe CF | 80% |
| CA Osasuna | 79% |
| Villarreal CF | 76% |
| RC Celta | 73% |
| FC Barcelona | 67% |
In many teams, a small number of players generate most of the output.
This suggests that crossing effectiveness is not evenly distributed across the squad.
Tactical interpretation
The data supports a dual model of crossing success:
Model 1: Volume
Teams rely on bringing more players into the box, increasing the probability of generating shots.
Model 2: Efficiency
Teams rely on the quality of the crosser, generating fewer but more effective actions.
The most effective teams combine both.
Final insights
Crossing is responsible for approximately 32% of open play goals in LALIGA.
Box density increases the probability of generating a shot, but reduces efficiency in finishing.
The build-up phase does not differentiate successful crosses.
The number of attacking players has a moderate impact, but is not decisive.
The biggest differences appear at the level of individual execution.
Final question
Are you training the cross… or the player who delivers it?