
11 Jul Expected Goals: A Revolutionary Metric or Just a Piece of the Puzzle?

Expected Goals: A Revolutionary Metric or Just a Piece of the Puzzle?
Abstract
The analysis of Expected Goals (xG) has gained notable popularity in the football world in recent years. This metric evaluates the quality of scoring opportunities a team generates, providing an estimate of how many goals «should» have been scored based on the characteristics of their shots. While xG offers valuable insights, our analysis of the 2022-2023 and 2023-2024 LALIGA EA Sports seasons reveals both its strengths and limitations. This study highlights the discrepancies between actual and expected outcomes, the implications for team performance, and the prudence required in the use of xG.
Introduction
Expected Goals (xG) have become a staple in football analytics, providing a nuanced perspective on a team’s offensive and defensive capabilities. By assessing the probability of scoring from various positions and scenarios, xG aims to quantify the quality of goal-scoring opportunities. However, the practical application and reliability of xG as a predictive tool remain subjects of debate. This paper examines the correlation between xG and actual goals scored across two LALIGA seasons and explores the broader implications for team performance evaluation.
Methods
Data from the 2022-2023 and 2023-2024 LaLiga EA Sports seasons were analyzed, focusing on Expected Goals (xG) and actual goals scored. The correlation between these variables was calculated using Pearson’s correlation coefficient, and linear regression analysis was conducted to determine the R2 value. Additionally, the study compared actual league standings with hypothetical standings based on xG to highlight the impact on championship outcomes and relegation battles.
Results
Correlation Analysis
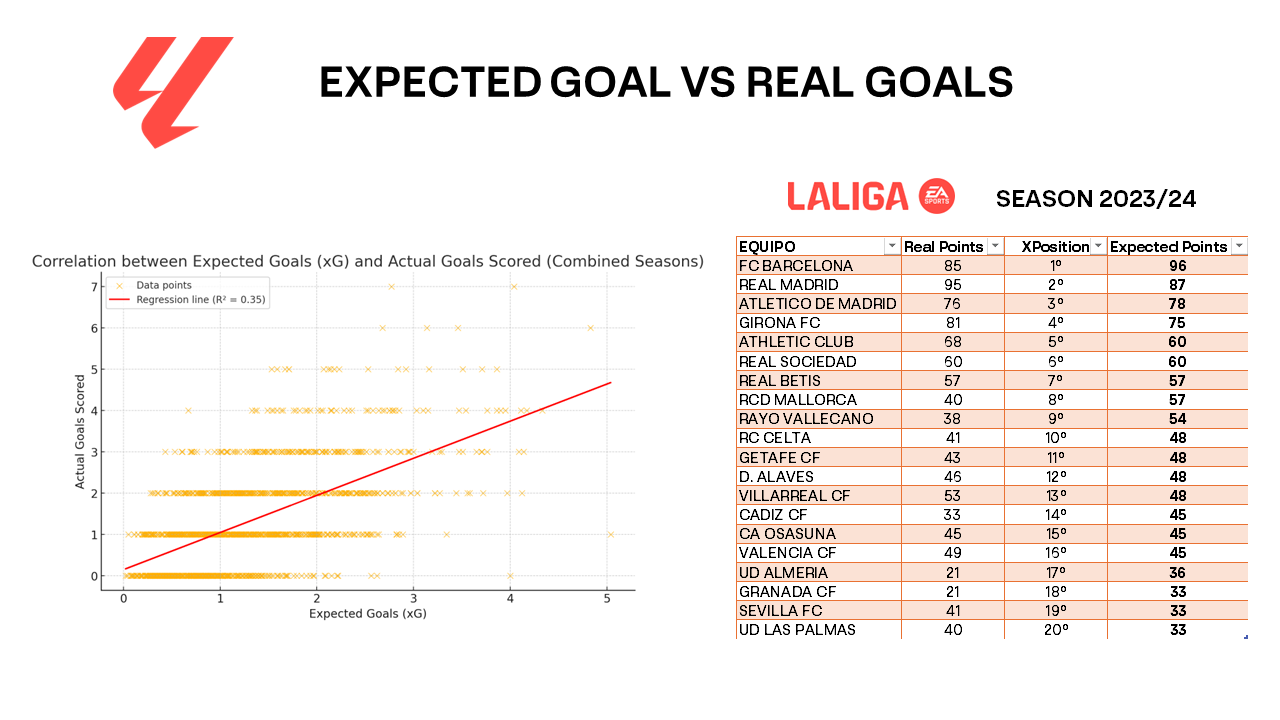
For the 2022-2023 season, the Pearson correlation between xG and actual goals was found to be 0.62, indicating a moderate positive relationship. In the 2023-2024 season, the correlation was 0.57. When combining data from both seasons, the overall Pearson correlation was 0.59, with an R2R^2R2 value of 0.35. These findings suggest a moderate level of predictability, with xG explaining 35% of the variance in actual goals scored.
Comparative Standings
The comparative analysis between actual points and xG-based points revealed significant differences in team standings. In the 2023-2024 season, Real Madrid won LALIGA with 95 actual points, whereas the xG model predicted FC Barcelona as the champion with 96 xG points. This discrepancy underscores the influence of factors beyond scoring opportunities, such as finishing quality and defensive performance.
Relegation Impact
The study also examined the relegation outcomes. According to actual points, UD Almería, Granada CF, and Cádiz CF were relegated. However, based on xG, these teams would have performed significantly better:
- UD Almería: 15 additional points based on xG, potentially avoiding relegation.
- Granada CF: 12 additional points, also avoiding relegation.
- Cádiz CF: 12 more points, securing a position in the top division.
Conversely, Sevilla FC, which outperformed their xG significantly, avoided relegation in reality but would have been at risk if their results had more closely reflected their xG.
Discussion
The moderate correlation and discrepancies between xG and actual outcomes highlight the limitations of xG as an absolute metric. While xG provides valuable insights into the quality of scoring opportunities, it does not account for the variability and randomness inherent in football matches. Factors such as finishing efficiency, goalkeeper performance, and luck play crucial roles in determining match results.
Conclusion
Expected Goals have revolutionized football analysis by offering a deeper look into the quality of scoring opportunities. However, it is essential to use xG as a complementary tool within a broader analytical framework. Recognizing its limitations and combining it with other metrics and qualitative observations can provide a more balanced and comprehensive understanding of team and player performance.