
13 Ene When You Change Division, You Don’t Need Better Players. You Need Different Profiles.
Every summer, the same scene repeats itself.
A club gets promoted. Or relegated.
Meetings multiply. Reports pile up.
Someone says: “We need players who can cope with the new level.”
The intention is right.
The question is wrong.
The real challenge is not whether your players are “good enough”.
It is whether your squad is structurally aligned with the demands of the competition you are about to play.
This article is built around a single applied tool:
a position-specific comparison framework that shows how the average player in the First and Second Division differs across a set of physical and technical–tactical metrics.
Not to judge players.
But to plan squads with fewer blind spots.
This research, led by Miguel Lampre-Ezquerra from Universidad San Jorge and developed in collaboration with the Football Intelligence and Performance Department at LALIGA, has been published in a peer-reviewed scientific journal. What follows is its applied interpretation for professional football practice.
Why Promotion and Relegation Are Where Data Becomes Most Misleading
Transitions between divisions are extreme contexts.
For promoted teams, the instinct is to reinforce everything.
For relegated teams, the instinct is to assume continuity will be enough.
Both reactions often rely on isolated indicators:
- Total distance
- Sprint counts
- Pass volume
- Physical output averages
The problem is not the data.
The problem is how comparisons are made.
Most analyses fail to answer three basic questions:
- Compared to which competition?
- In which playing position?
- Across which set of demands?
The visual comparison tool that accompanies this article exists to answer those questions in a structured way.
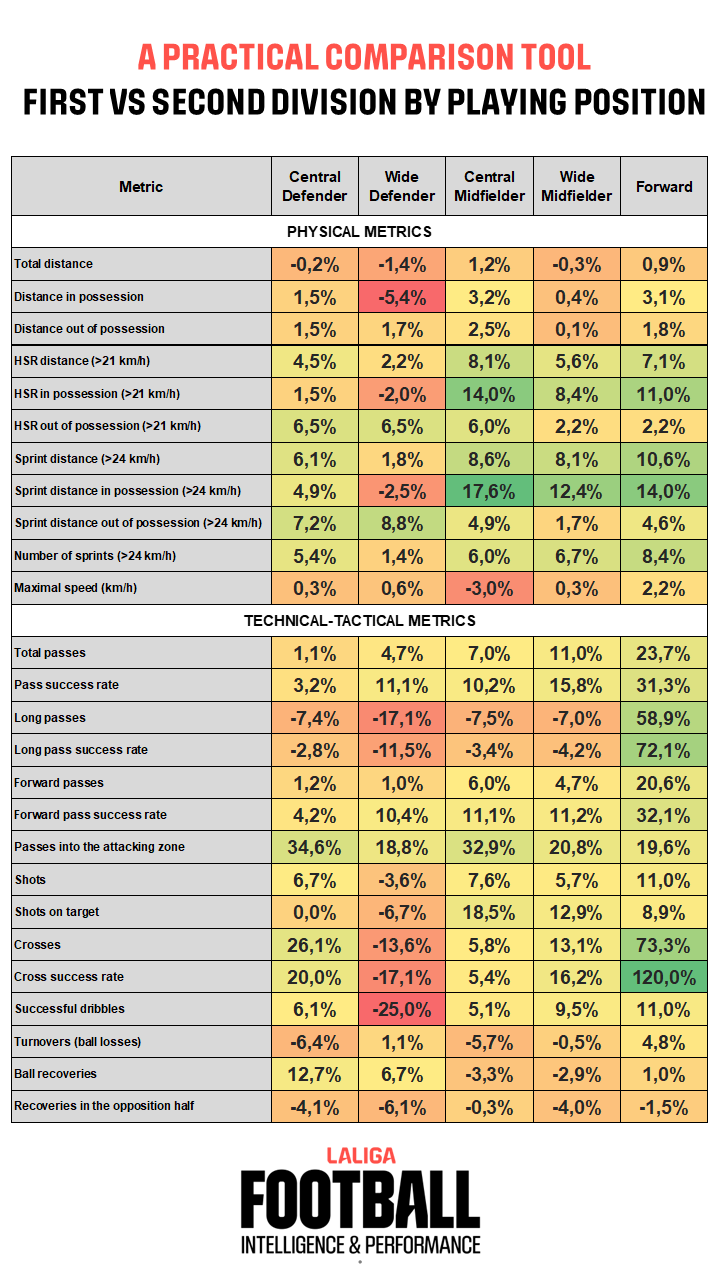
What This Comparison Tool Actually Represents
The figure shows percentage differences between First and Second Division players, broken down by:
- Playing position
- Physical metrics (with and without possession)
- Technical–tactical metrics
Each cell compares the average player in each competition for a given position.
This point cannot be overstated.
This tool is not:
- A player ranking
- A scouting filter
- A measure of individual quality
This tool is:
- A normalisation template between competitions
- A way to visualise how the job description of each position changes
- A framework to support squad planning decisions in moments of transition
The value lies not in a single percentage, but in the pattern across metrics and positions.
First Key Insight: The Competitive Jump Is Not the Same for Every Position
One of the clearest messages of the tool is also one of the most uncomfortable:
There is no universal “First Division demand profile”.
The differences between competitions:
- Are position-specific
- Affect clusters of metrics, not isolated variables
- Combine physical and technical–tactical dimensions
For example:
- Central defenders show very small physical differences between divisions, but relevant technical ones.
- Central midfielders and forwards face higher exposure to high-intensity actions during possession and to greater technical involvement.
- Wide defenders combine increased high-speed actions both with and without the ball, reflecting their dual role.
This immediately challenges a common planning error:
treating the change of category as a uniform increase in difficulty.
Second Insight: “More” Does Not Mean “Better”. It Means “Different Exposure”.
The percentages shown in the tool are often misinterpreted.
A +10% difference does not mean:
- A player is better
- A player is fitter
- A player is more prepared
It means:
- That position, in that competition, is exposed more frequently to that type of action
- Within a specific tactical and contextual environment
Likewise, negative values do not indicate inferiority.
They often reflect different styles of play, such as:
- Greater use of long passes
- More direct attacking approaches
- Different defensive responsibilities
Understanding this distinction is essential when planning squads after promotion or relegation.
Using the Tool to Plan Squads After Promotion
For promoted teams, the key question is not “Who can survive in First Division?”
It is:
Which positions in my current squad are already close to the First Division average profile, and where are the real mismatches?
The tool allows clubs to:
- Identify positions where the gap is mainly technical–tactical, not physical
- Detect roles where the competitive jump implies more actions under pressure, not more volume
- Prioritise recruitment by positional misalignment, not by reputation
In practice:
- Some central defenders may require minimal adaptation.
- Some midfielders or forwards may face a radically different decision-making environment.
- Squad reinforcement becomes targeted instead of reactive.
Using the Tool to Reconfigure Squads After Relegation
For relegated teams, the risk is different.
The common assumption is that a First Division squad will automatically dominate the Second.
The comparison tool suggests a more nuanced reality.
Relegation changes:
- The distribution of technical actions
- The nature of physical demands
- The relative value of certain player profiles
By applying this normalisation framework, clubs can:
- Reassess which players are over-adapted to a context that no longer exists
- Identify profiles that may actually become more influential in the Second Division
- Avoid misinterpreting reduced demands as reduced importance
This is not about downgrading quality.
It is about realigning roles with competition context.
Why Reading Performance by Position Changes Internal Conversations
One of the most practical effects of this tool is cultural.
It helps staffs move from statements like:
- “He runs less.”
- “He has fewer actions.”
To better questions:
- “Less compared to which competition?”
- “Is this normal for his position at this level?”
- “Are we using the right reference?”
In moments of promotion or relegation, this shift in questioning can be decisive.
Methodological Notes (Without Losing the Practical Focus)
The analysis is based on:
- 1,608 official matches
- Two full seasons
- Only players completing full matches
- Validated positional classification
- Tracking data (TRACAB, Mediacoach) and event data (OPTA)
Effective playing time was not explicitly adjusted. Previous research shows that this may reduce some physical differences between divisions. However, separating possession and non-possession phases already provides a strong contextual framework.
The goal is not to claim absolute truths, but to offer a robust comparative reference.
Conclusion: Change the Reference Before You Change the Squad
Promotion and relegation are not problems of quality.
They are problems of alignment.
This comparison tool does not tell you who to sign.
It helps you understand what you are signing for.
Used properly, it becomes:
- A shared language between coaching, performance and analysis
- A safeguard against simplistic interpretations
- A strategic asset in the moments where mistakes are most expensive
In football, assumptions travel fast.
Data should travel better.
📄 Scientific article (DOI): https://doi.org/10.5114/biolsport.2026.156233