


07 Jul Goalkeeper Data Is Not Always Goalkeeper Performance
Football assigns many numbers to goalkeepers.
Goals conceded. Shots faced. Shots on target faced. xGOT conceded. Expected goals against. Crosses faced. Saves. Clean sheets. Goals prevented.
They all appear in the goalkeeper’s statistical profile.
But they do not all measure the goalkeeper in the same way.
That distinction is crucial.
Some metrics describe what the goalkeeper does. Others describe what the team allows the goalkeeper to face. Many sit somewhere in between. The analytical mistake is treating all of them as if they carried the same level of individual responsibility.
They do not.
Attribution Is Not the Same as Responsibility
A shot on target is assigned to the goalkeeper’s profile. But the goalkeeper did not necessarily create the conditions that allowed the shot to exist.
The sequence may have started with a failed press, poor protection of central areas, a lost duel, a disorganised defensive line, a passive block or a cross allowed under no pressure. By the time the goalkeeper appears in the data, the defensive problem may already have been produced.
This is one of the most important issues in goalkeeper analysis.
The goalkeeper is often the statistical owner of the final event in a defensive sequence. But being the statistical owner of an event is not the same as being the main tactical cause of that event.
In other words:
Goalkeeper data is often individual in attribution, but collective in production.
Measuring the Degree of Goalkeeper Attribution
To make this idea more practical, we built a Direct GK Influence Score for goalkeeper-attributed metrics.
The objective was not simply to classify metrics by intuition. The aim was to test how each metric behaved when compared with external contextual variables related to the team and the opponents.
Each club was treated as a single goalkeeper unit, aggregating all goalkeeper minutes across the season. This reduced the noise created by teams that used more than one goalkeeper.
For each goalkeeper-attributed metric, we analysed its relationship with four external context variables:
| Context variable | Interpretation |
|---|---|
| Team defensive avoidance efficiency | How effectively the team prevents opponent possessions from becoming dangerous |
| Team defensive containment efficiency | How effectively the team avoids conceding once the opponent has created danger |
| Opponent offensive construction efficiency | How effectively the team’s opponents progress possessions into dangerous areas |
| Opponent finishing efficiency | How effectively the team’s opponents convert dangerous possessions into goals |
The resulting score offers a practical way to visualise which goalkeeper metrics behave more like individual-response indicators and which behave more like team- or opponent-context indicators.
A higher score means that, in this dataset, the metric was less strongly associated with those external context variables. A lower score means that the metric was more strongly associated with the defensive environment, opponent quality or exposure created before the goalkeeper’s intervention.
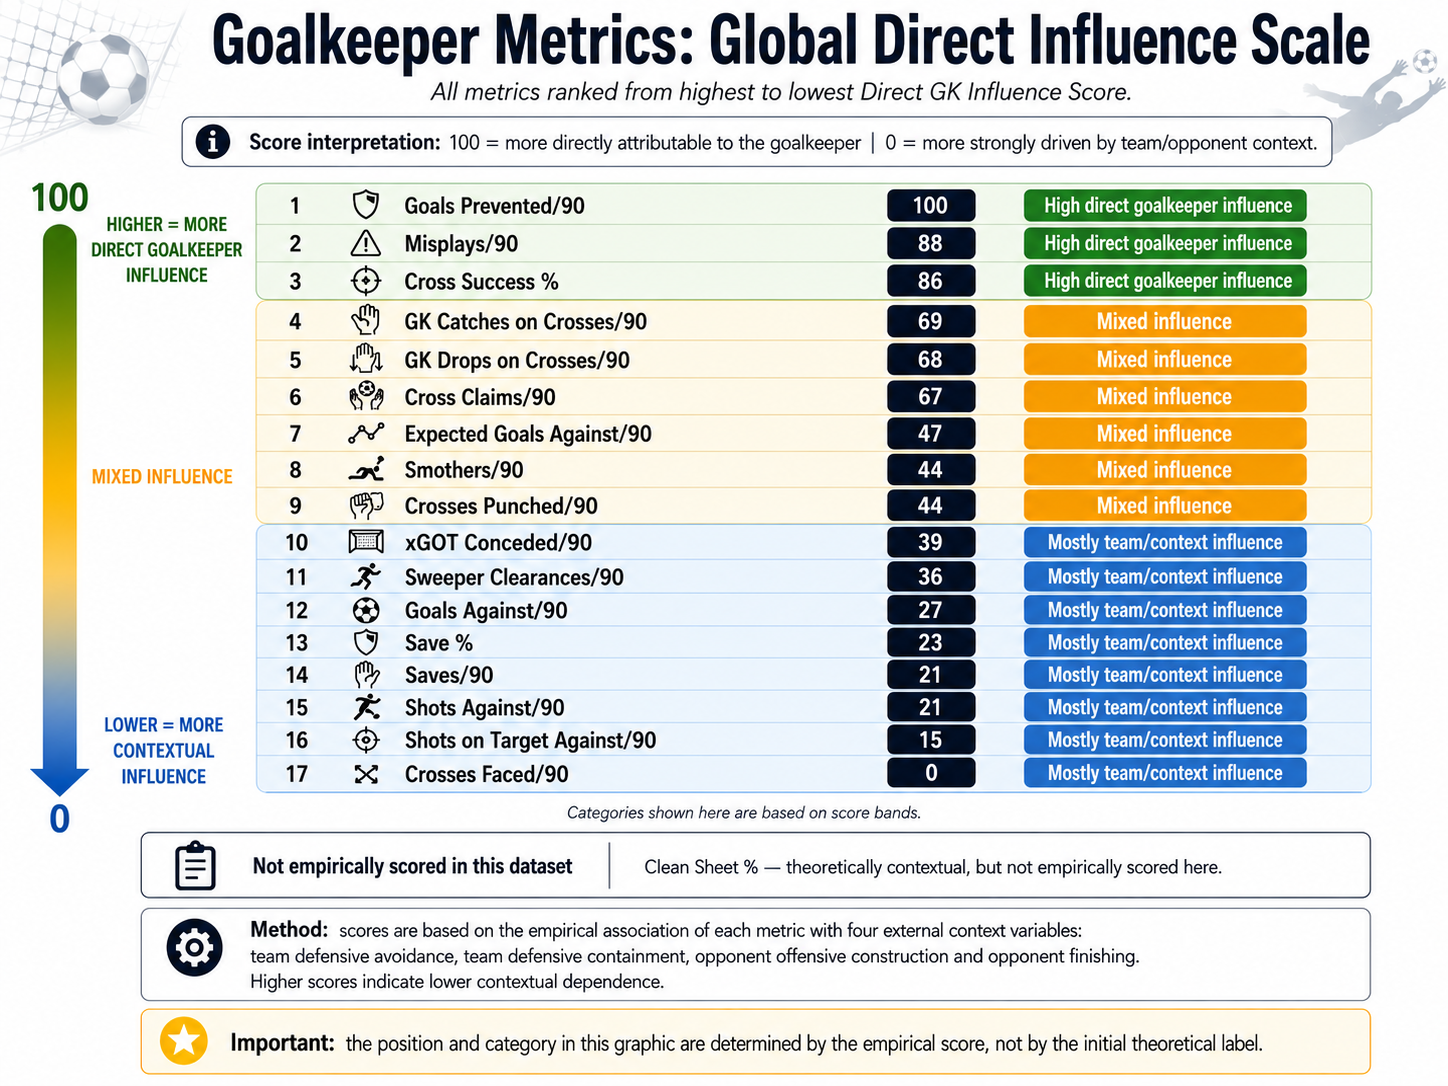
The Direct GK Influence Scale
The results were revealing.
| Rank | Metric | Direct GK Influence Score | Interpretation |
|---|---|---|---|
| 1 | Goals Prevented/90 | 100 | Highest goalkeeper-response signal in this analysis |
| 2 | Misplays/90 | 88 | Strongly linked to goalkeeper action/error |
| 3 | Cross Success % | 86 | Strong goalkeeper influence in aerial actions |
| 4 | GK Catches on Crosses/90 | 69 | Mixed influence |
| 5 | GK Drops on Crosses/90 | 68 | Mixed influence |
| 6 | Cross Claims/90 | 67 | Mixed influence |
| 7 | Expected Goals Against/90 | 47 | Mixed influence |
| 8 | Smothers/90 | 44 | Mixed influence |
| 9 | Crosses Punched/90 | 44 | Mixed influence |
| 10 | xGOT Conceded/90 | 39 | Mostly contextual |
| 11 | Sweeper Clearances/90 | 36 | Mostly contextual in this dataset |
| 12 | Goals Against/90 | 27 | Strongly influenced by team and opponent context |
| 13 | Save % | 23 | More contextual than it may appear |
| 14 | Saves/90 | 21 | A goalkeeper action, but volume depends heavily on exposure |
| 15 | Shots Against/90 | 21 | Mostly defensive exposure |
| 16 | Shots on Target Against/90 | 15 | Mostly defensive exposure |
| 17 | Crosses Faced/90 | 0 | Most context-dependent metric in the analysis |
Several findings are especially important.
First, Goals Prevented/90 appears as the metric least associated with external context variables. That makes sense. It does not simply count what the goalkeeper faces; it compares the quality of shots on target conceded with the goals actually allowed. It is therefore closer to a response metric.
Second, Saves/90 appears much lower than many people might expect. This does not mean that a save is not a goalkeeper action. It means that the number of saves per 90 is strongly shaped by exposure. A goalkeeper cannot accumulate saves unless his team allows shots on target.
Third, Save % also appears more contextual than it may look. A high or low save percentage depends not only on the goalkeeper, but also on the type of shots conceded. Saving a high volume of low-quality shots and saving a small number of high-quality shots are not the same performance problem.
Finally, metrics such as Shots Against/90, Shots on Target Against/90 and Crosses Faced/90 sit at the bottom of the scale. They are assigned to the goalkeeper, but they largely describe what the team allows to reach him.
Why Context-Heavy Metrics Can Mislead
Context-heavy goalkeeper metrics are not useless. In fact, they are extremely valuable.
They tell us what type of defensive environment the goalkeeper is operating in. They help describe whether the team allows many shots, whether those shots are dangerous, whether the goalkeeper faces constant aerial pressure, and whether the defensive structure protects or exposes him.
The problem is not using these metrics.
The problem is using them as if they were purely individual.
A goalkeeper facing many shots is not necessarily worse. He may simply play in a team that allows more finishing situations. A goalkeeper facing few shots is not necessarily better. He may be protected by a structure that prevents opponents from reaching dangerous areas.
The same applies to clean sheets.
A clean sheet is partly connected to the goalkeeper, but it is heavily influenced by the defensive block, pressure on the ball, centre-back behaviour, midfield protection, game state, opponent quality and chance variation. It is a meaningful outcome, but not a pure goalkeeper metric.
This distinction matters because the name attached to the metric is not always the player most responsible for producing it.
A Practical Test: Three Rankings, Three Attribution Models
To show the practical effect of metric attribution, we ranked goalkeepers in three different ways.
Only goalkeepers with at least 1,800 minutes were included. Count metrics were converted to per-90 values, percentage metrics were kept as percentages, negative metrics were inverted, all metrics were normalised from 0 to 100, and each metric was weighted by its Direct GK Influence Score.
The three models were:
| Model | Metrics included | Main interpretation |
|---|---|---|
| High Direct Influence Index | Goals Prevented/90, Misplays/90, Cross Success % | Closest to direct goalkeeper response |
| High + Mixed Influence Index | High direct metrics plus catches, drops, claims, expected goals against, smothers and punches | Goalkeeper response plus actions shaped by exposure |
| All-Metrics Weighted Index | All available goalkeeper metrics, weighted by Direct GK Influence Score | Goalkeeper performance within the broader defensive environment |
The results show why attribution matters.
| Goalkeeper | Club | High Direct Rank | High + Mixed Rank | All Metrics Rank |
|---|---|---|---|---|
| Joan García | Barcelona | 1 | 3 | 1 |
| Aarón Escandell | Real Oviedo | 2 | 5 | 8 |
| O. Vlachodimos | Sevilla | 3 | 6 | 9 |
| Marko Dmitrović | Espanyol | 4 | 2 | 3 |
| Paulo Gazzaniga | Girona | 5 | 4 | 6 |
| Stole Dimitrievski | Valencia | 6 | 1 | 2 |
| Jan Oblak | Atlético de Madrid | 7 | 7 | 4 |
| Thibaut Courtois | Real Madrid | 8 | 8 | 5 |
| David Soria | Getafe | 9 | 13 | 11 |
| Ionut Radu | Celta de Vigo | 10 | 11 | 10 |
| Luiz Júnior | Villarreal | 13 | 9 | 7 |
| Mathew Ryan | Levante | 12 | 10 | 12 |
The same goalkeepers produce different rankings depending on which attribution layer is prioritised.
That is not a flaw in the data.
It is the point.
When we focus only on the highest direct-influence metrics, Joan García leads the ranking, followed by Aarón Escandell and O. Vlachodimos. This version is closer to direct goalkeeper response, although still not perfectly context-free.
When mixed metrics are added, the ranking changes. Stole Dimitrievski and Marko Dmitrović rise strongly because the model now rewards a broader set of penalty-area actions: claims, catches, punches, smothers and aerial involvement. This is a more functionally complete view of the position, but it also brings more exposure into the model.
When all metrics are included, even with contextual metrics weighted less heavily, the ranking shifts again. Joan García returns to first place. Oblak and Courtois also rise, reflecting the role of broader defensive environment and outcome-related metrics.
This is the practical consequence of attribution.
The ranking changes because the question changes.
What This Means for Goalkeeper Evaluation
Before evaluating a goalkeeper, we need to separate exposure from response.
Contextual metrics help answer questions such as:
- How much danger does the team allow?
- How often does the goalkeeper face shots?
- How dangerous are those shots?
- How much lateral or aerial pressure reaches the box?
- How protected is the goalkeeper by the defensive structure?
Action-based and response-based metrics help answer different questions:
- How well does the goalkeeper stop the shots he faces?
- Does he prevent more goals than expected?
- Does he claim or punch crosses effectively?
- Does he control depth behind the defensive line?
- Does he reduce danger through his own interventions?
Both types of information are necessary.
But they should not be treated as the same type of evidence.
For scouting, this distinction is essential. A goalkeeper moving from a low-exposure team to a high-exposure team may face a completely different performance problem. A goalkeeper with strong clean-sheet numbers may not carry the same outcome into a team that allows more central shots. A goalkeeper with many saves may be performing well, but the volume of saves may also reflect a defensive structure that leaves him exposed.
For benchmarking, the same principle applies. Comparing goalkeepers without separating context from action can reward players for protection provided by their teams or punish players for defensive problems they did not create.
For communication with coaches, the distinction is even more important. If the objective is to improve the goalkeeper, action-based metrics are more useful. If the objective is to improve the team’s defensive structure, contextual goalkeeper metrics may be more informative.
The same data can be useful for different purposes.
But only if we know what question each metric is answering.
Conclusion
Goalkeeper analysis becomes more meaningful when attribution and responsibility are treated as separate questions.
Some metrics describe the goalkeeper’s actions. Others describe the environment that reaches him. Many combine both.
That distinction matters for scouting, benchmarking, recruitment and performance analysis.
Before comparing goalkeepers, we should ask what kind of evidence we are using. Are we measuring the goalkeeper’s response, the team’s defensive protection, the opponent’s attacking quality, or the final outcome of all three?
In football data, attribution is often individual.
Production is often collective.
Understanding the difference may be one of the most important steps towards evaluating goalkeepers more accurately.
Methodological Note
The Direct GK Influence Score should be interpreted as a relative attribution index, not as a causal percentage of goalkeeper responsibility.
The score was derived from the inverse of observed context dependence. In practical terms, goalkeeper-attributed metrics were compared against four external context variables: team defensive avoidance, team defensive containment, opponent offensive construction and opponent finishing. Metrics that were less strongly associated with those external variables received higher scores; metrics that were more strongly associated with team or opponent context received lower scores.
This means that a high score does not prove that the goalkeeper is the sole cause of the metric. Rather, it indicates that, in this dataset, the metric behaved more like a goalkeeper-response indicator than a team- or opponent-context indicator. Similarly, a low score does not make a metric useless; it means that the metric should be interpreted primarily as part of the defensive environment around the goalkeeper.
The purpose of the scale is therefore interpretative: to help separate goalkeeper response, defensive exposure and contextual noise before using goalkeeper data for ranking, scouting or benchmarking.