
30 Ene How to Analyze the Variation of the Opponent’s Defensive Block Based on Match Context
In football tactical analysis, teams are often classified as defending in a high, mid, or low block. However, this static classification does not reflect the dynamic nature of the game, where a team’s defensive block varies depending on multiple factors: the scoreline, opponent intensity, game phase, or even the attacking structure of the opposition.
At LALIGA’s Football Intelligence & Performance Department, we work on advanced game analysis through data and technological tools that help teams better understand their own performance and that of their opponents. Mediacoach Vision, developed in collaboration with Footovision, is one of the solutions integrated within the suite of products and services offered by Mediacoach, the analysis tool that Sportian provides to LALIGA clubs.
Within Mediacoach Vision, a specific graphic allows precise analysis of how the opponent’s defensive block evolves throughout the match in relation to each offensive possession sequence. This analysis is crucial for detecting when and why the opponent modifies its defensive structure, providing essential insights for strategy planning and tactical decision-making.
Description of the Defensive Block Variation Graphic
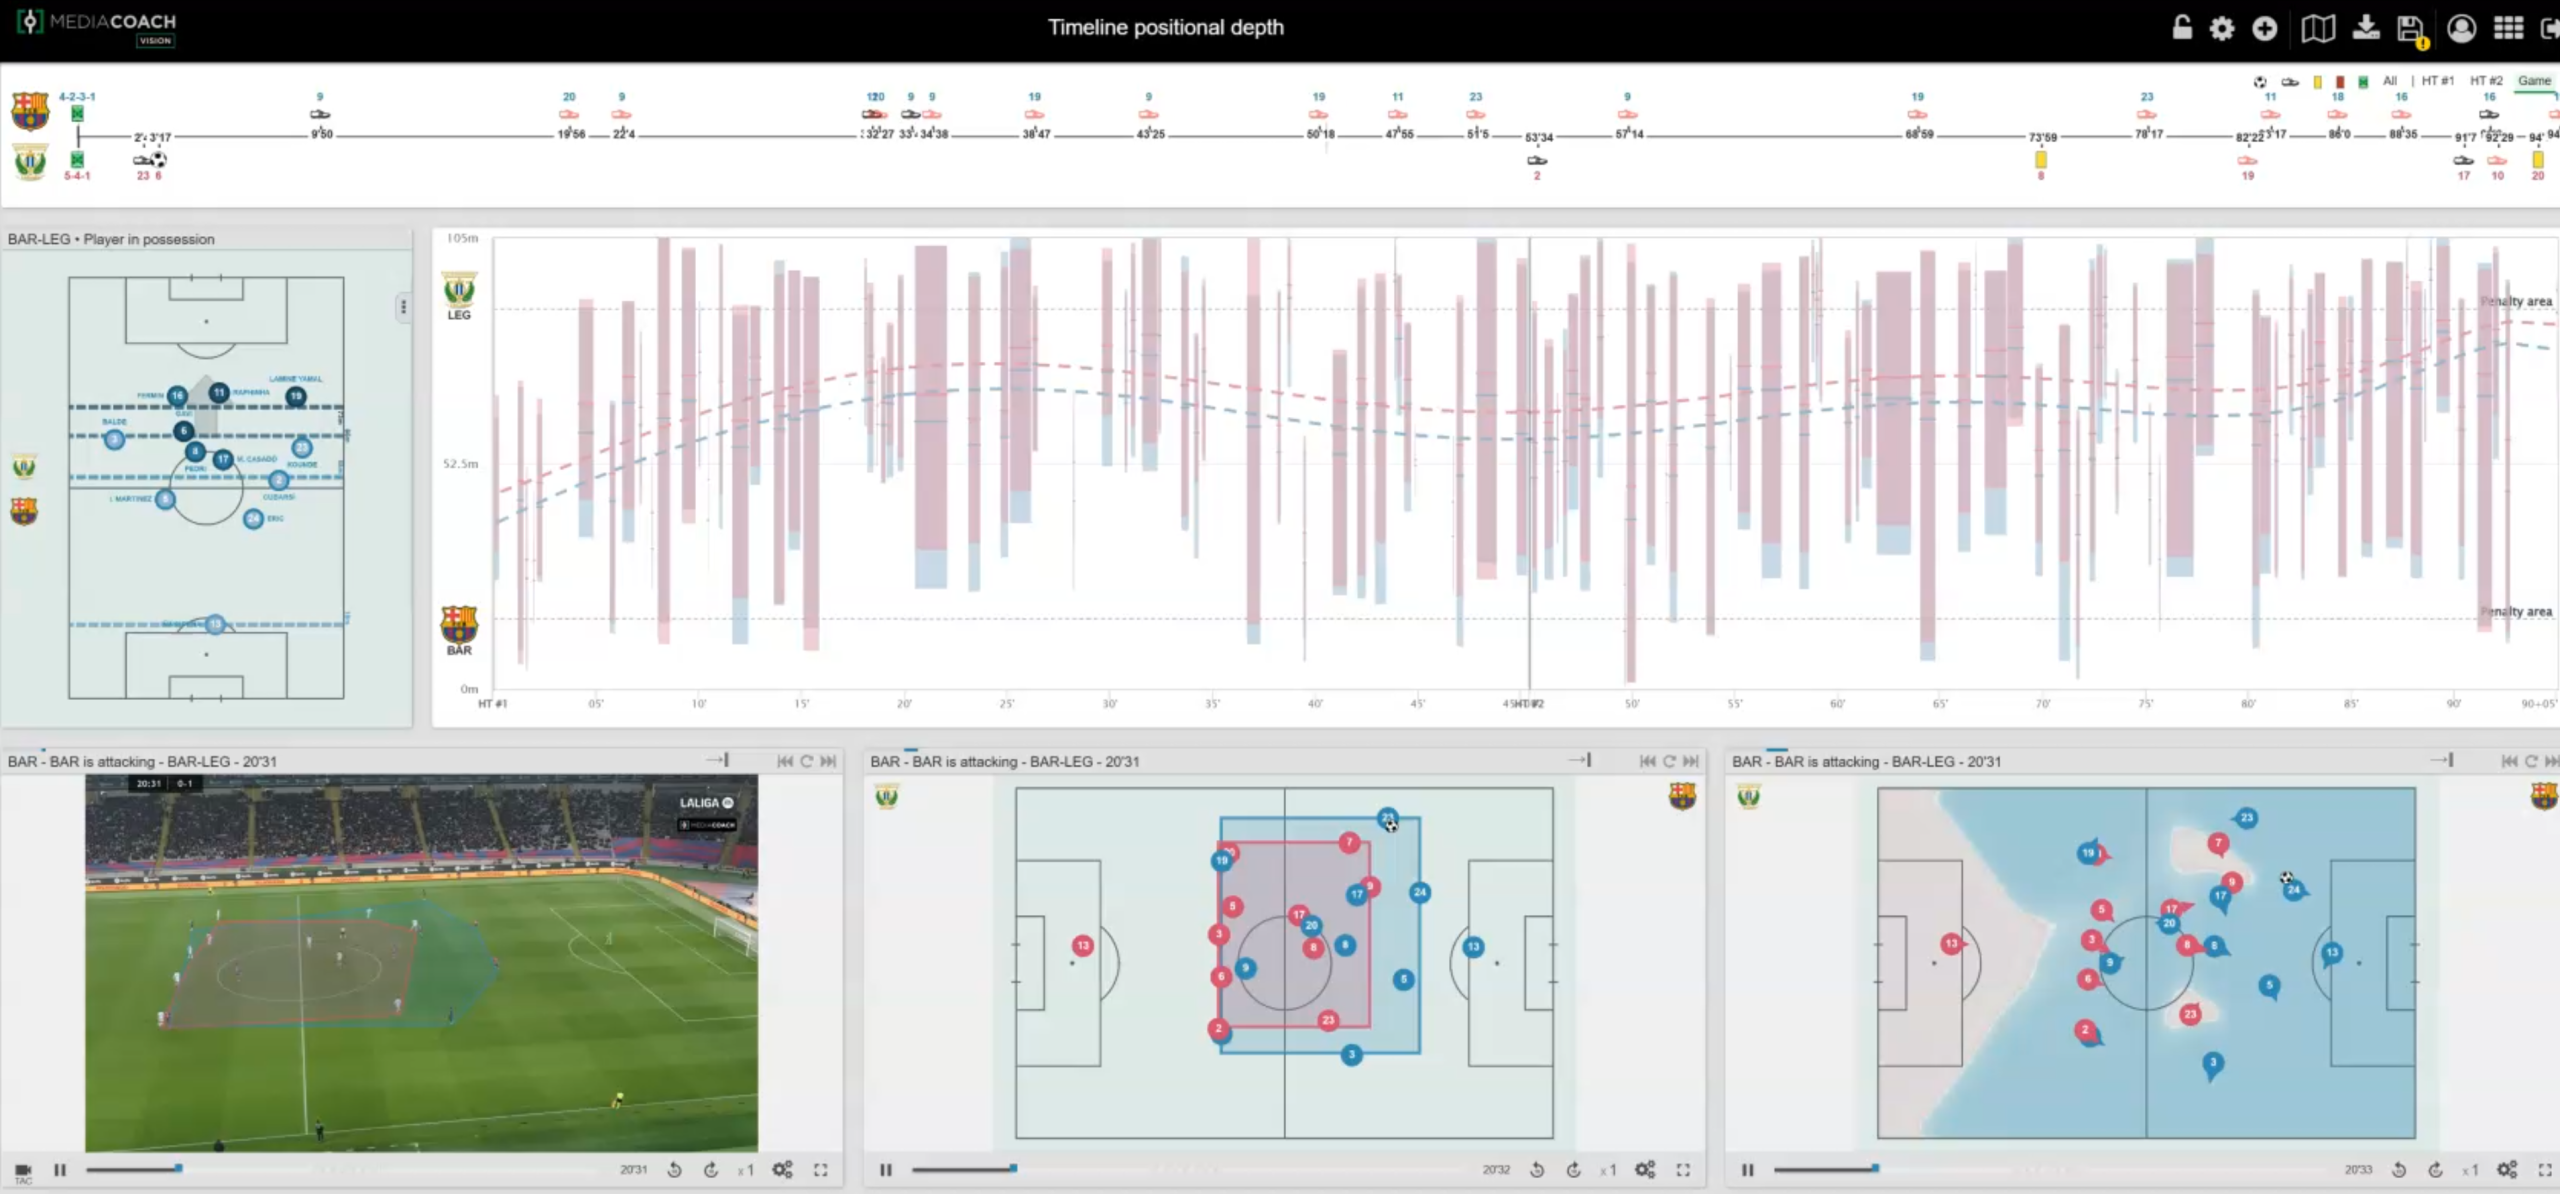
The graphic available in Mediacoach Vision represents field depth in meters along the X-axis, establishing clear spatial references:
- 0 meters: Goal line of the home team, in this case, FC Barcelona.
- 105 meters: Goal line of the away team, in this case, CD Leganés.
The graphic clearly shows how the visiting team starts the match with a high defensive block, stabilizes in a mid-block for most of the game, and ends up defending in a low block in the final minutes. This type of analysis allows us to visualize how the opponent’s defensive strategy evolves based on match context, breaking the misconception that a team defends in the same way throughout the entire game.
The graphic consists of the following key elements:
- Possession Bars
- Each bar represents a possession sequence of the team in the offensive phase.
- Its position on the X-axis indicates the deepest and most advanced point reached by any player (excluding the goalkeeper) during that possession.
- The height of the bar reflects the possession’s depth, meaning how far up the field the team reached in relation to the opponent’s goal.
- Its overlap with the opponent’s centroid line allows for precise identification of the opponent’s defensive block at each moment in the match.
- Opponent Centroid Line
- Represents the average position of the opposing team at each moment in the match.
- Its movement along the X-axis helps identify retreats, high pressing phases, or defensive structure adjustments.
- If the line remains high, it indicates that the opponent is pressing in a high block; if it gradually drops, it shows how the team is retreating into a mid or low block.
Interpreting the Graphic: Detecting the Evolution of the Defensive Block
This graphic provides an entirely objective analysis of how the opponent’s defensive structure changes throughout the match, answering key tactical planning questions:
- How does the scoreline impact the opponent’s defensive structure?
If a team starts by pressing in a high block but, after scoring a goal or reaching the final minutes, its centroid line gradually drops, the graphic will clearly reflect this variation. - Does the opponent maintain high pressure throughout the match, or only in specific moments?
By observing the evolution of possession bars and their relation to the opponent’s centroid line, it is possible to detect whether the opposing team starts with high pressing but drops its defensive block as the match progresses. - How does the opponent’s defensive block react to our offensive phases?
If long possessions with offensive progression result in the opponent quickly retreating, it may indicate a defensive strategy focused on minimizing space in the final third. Conversely, if the opponent maintains a consistently high block, it suggests they prioritize sustained high pressing. - How do transitions influence the opponent’s defensive structure?
Observing bars that extend from very deep areas of the field can reveal whether the opponent is forcing the team to initiate attacks from lower positions, which may indicate effective pressing after losing possession.
Detailed Analysis Using Mediacoach Vision’s Viewers
To provide a more in-depth analysis of each possession sequence, Mediacoach Vision allows visualization of each play through three complementary viewers:
- Tactical Camera with Convex Hull
- Displays the space occupied by both teams in each game phase.
- Helps evaluate the compactness of the opponent at different moments of the match.
- Radar View in 2D Tiles
- Represents the width and depth of the opponent’s defensive block.
- Facilitates the analysis of how the opponent organizes itself in different match scenarios.
- Pitch Control
- Indicates which team has a higher probability of controlling each zone of the pitch.
- Helps evaluate pressing effectiveness and space occupation in both offensive and defensive phases.
These viewers complement the main graphic analysis, providing a detailed perspective on the opponent’s tactical behavior during each possession sequence.
Conclusion
Understanding the opponent’s defensive block evolution throughout a match is fundamental for assessing how a team adjusts its structure based on game context. Thanks to Mediacoach Vision, developed in collaboration with Footovision and available as part of the suite of products and services of Mediacoach, the analysis tool that Sportian provides to LALIGA clubs, coaching staffs can precisely analyze these changes and make data-driven tactical decisions.
At the Football Intelligence & Performance Department of LALIGA, we focus on implementing advanced analysis tools that translate information into actionable insights for coaches in a clear and accessible manner.
This graphic provides an objective visual representation of when, how, and why the opponent modifies its defensive block, offering crucial information for tactical planning and optimizing offensive strategies based on the opponent’s behavior.