
24 Jul «Knowing a flag is red is not enough. What matters is why it was raised—and how heavy it is.»
When everyone is at risk, the model stops working
The day before a match, performance staff receive their injury risk report. It looks familiar: five players in red, six in orange, and maybe three in green. At first glance, it seems everything is under control. The traffic light model is doing its job.
But what happens when most of the squad is «in red» week after week? Is everyone truly at high risk? Or is the model too sensitive—and not specific enough to guide real decisions?
For years, most injury prediction tools have relied on just three variables: training load, rest, and injury history. While each one is meaningful on its own, they are often so closely correlated that they overlap. The outcome: oversensitive models that generate noise instead of clarity.
At LALIGA’s Football Intelligence & Performance Area, we decided to build something better. We wanted to keep the traffic light—but give it depth. Behind every colour, there had to be a reason. Behind every risk flag, a rationale.
That’s how this model was born: not a red–orange–green alert, but a contextual, weighted system that balances information, science and football logic.
Built from evidence. Designed for real decisions.
The model was developed in four key phases:
-
- In-house scientific research
Ten peer-reviewed studies published by LALIGA and its academic partners, covering topics such as hamstring injuries, return to play, and post-injury performance profiles.
- In-house scientific research
-
- Complementary literature review
A careful review of published studies in elite football to identify measurable, underused variables with strong empirical support.
- Complementary literature review
-
- Variable selection and weighting
A final set of 18 objective, measurable variables, each assigned a weight from 1 to 3 based on its predictive power, scientific robustness, and clinical relevance.
- Variable selection and weighting
-
- Operational implementation
The model is used in professional settings as an automated report, updated weekly and tailored to each player. The aim: classify each player into a meaningful risk tier before every match.
- Operational implementation
This isn’t a flag system. It’s a profile-based evaluation. A red flag doesn’t mean panic. It means ask why—and how much it matters.
How does player classification work?
Each of the 18 variables is scored based on risk thresholds—defined using real-world evidence from scientific publications. The score is then multiplied by the weight assigned to that variable.
The total weighted score determines the final risk level:
-
- High risk: Total score ≥ 13
-
- Moderate risk: Score between 7 and 12
-
- Low risk: Score ≤ 6
Importantly: no player is classified as «red» based on a single indicator.
Even if a variable shows a red flag (e.g., ACTN3 XX genotype, weight = 3), the player’s total score needs to cross the high-risk threshold. This avoids the common pitfall of models that overreact to isolated red flags.
In practice, it means one thing: not all red is the same—and not all green is safe.
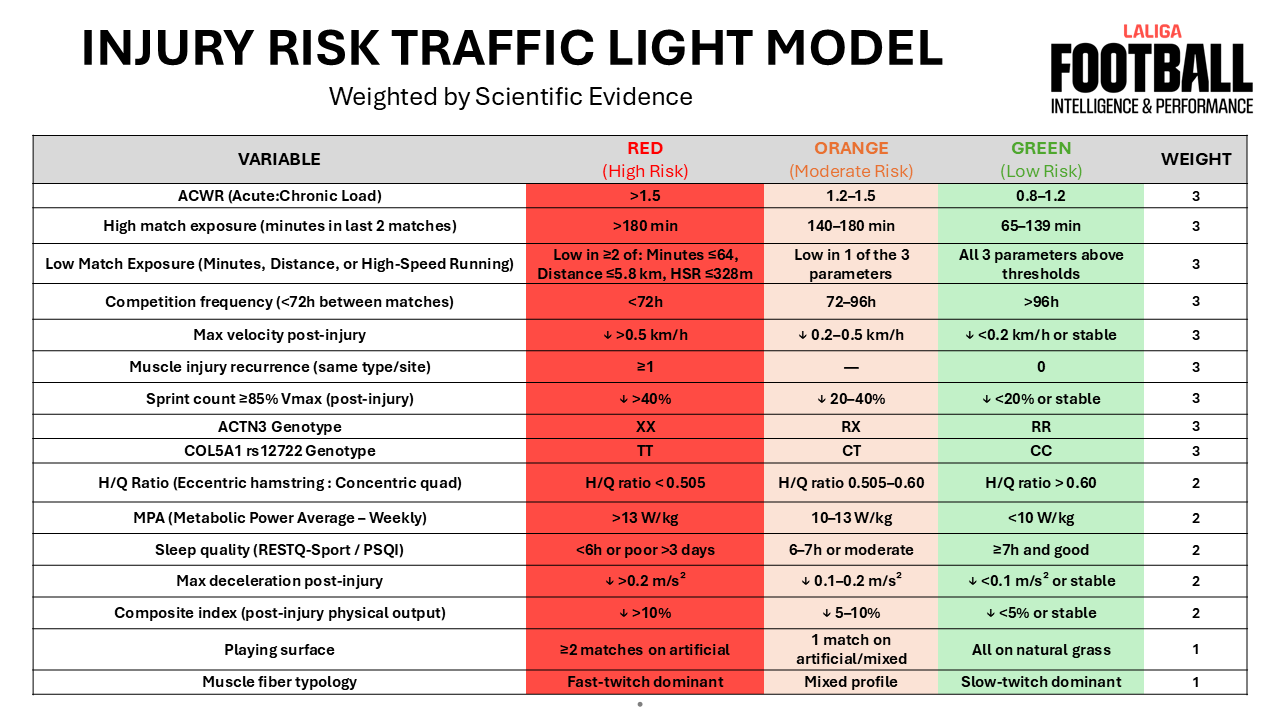
The 18 variables: structure, weight and scientific rationale
Below, we break down each of the 18 variables included in the model. Each section outlines:
-
- What the variable measures
-
- Why it was included
-
- The thresholds used for red, orange and green classification
-
- The scientific study that supports it (with direct DOI link)
-
- The weight assigned in the model
1. Acute:Chronic Workload Ratio (ACWR)
Why it matters: ACWR detects abrupt changes in physical stress by comparing short-term (7-day) load to longer-term (28-day) load. Sudden spikes without sufficient adaptation are strongly linked to muscle injury risk.
Thresholds:
-
- Red: >1.5
-
- Orange: 1.2–1.5
-
- Green: 0.8–1.2
Scientific reference:
Gabbett TJ (2016). The training-injury prevention paradox: should athletes be training smarter and harder? Br J Sports Med. https://doi.org/10.1136/bjsports-2015-095788
Weight in model: 3
2. High Match Exposure (Minutes Played in Last 2 Matches)
Why it matters:
Sudden accumulation of competitive minutes—especially after periods of lower involvement—is one of the clearest and most well-documented triggers for soft tissue injury. The match imposes unique neuromuscular and metabolic demands that cannot be replicated in training. When exposure is high and unbuffered by prior adaptation, the risk of overload increases exponentially.
This variable captures short-term competitive load based on minutes played in the two most recent matches. It reflects acute exposure that may exceed a player’s current tolerance.
Thresholds:
-
- Red: >180 minutes (total across 2 matches)
-
- Orange: 140–180 minutes
-
- Green: 65–139 minutes
Scientific reference:
Moreno-Pérez V, Paredes V, Pastor D, Bishop C, Del Coso J.
Influence of the Weekly and Match-Play Load on Muscle Injury in Professional Football Players.
International Journal of Sports Medicine, 2022.
https://doi.org/10.1055/a-1533-2110
Weight in model: 3
This variable receives the maximum weight due to:
-
- Strong evidence in professional football contexts
-
- High frequency of appearance in muscle injury case patterns
-
- Practical usability for coaching staff and load managers
3. Low Match Exposure (Minutes, Distance, or High-Speed Running)
Why it matters:
Injury risk is not only about overload—underload can be just as dangerous. Professional players who spend long periods without match-level exposure may become less conditioned for high-intensity actions, even if training loads remain high.
This variable captures situations of competitive underexposure, based on three indicators from the previous two matches:
-
- Total minutes played
-
- Total distance covered
-
- Distance covered at >24 km/h
If a player falls below threshold in two or more of these parameters, the risk increases substantially due to detraining or underpreparedness for match intensity.
Thresholds (any two of the following):
-
- Minutes played ≤ 64
-
- Total distance ≤ 5.8 km
-
- High-speed running (HSR) ≤ 328 m
Classification:
-
- Red: Below threshold in 2 or more parameters
-
- Orange: Below threshold in 1 parameter
-
- Green: All 3 parameters above threshold
Scientific reference:
Moreno-Pérez V, Resta R, Del Coso J, et al.
Reduced Match Exposure in the Previous 2 Matches Accounts for Hamstring Muscle Injury Incidence in Professional Football Players.
Orthopaedic Journal of Sports Medicine, 2023.
https://doi.org/10.1177/19417381231158117
Weight in model: 3
This variable has high predictive value. In the referenced study, players with reduced exposure in the 2 previous matches were significantly more likely to suffer hamstring injuries, even when training volume remained stable.
4. Competition Frequency (Less Than 72 Hours Between Matches)
Why it matters:
Muscle recovery doesn’t follow the match calendar. When matches are played too close together, players are exposed to high mechanical and neuromuscular demands before full recovery is achieved. This cumulative fatigue increases the likelihood of non-contact muscle injuries—especially in high-intensity positions or roles.
This variable captures the time elapsed between the two most recent competitive fixtures, highlighting players exposed to congested schedules.
Thresholds:
-
- Red: Less than 72 hours between matches
-
- Orange: Between 72 and 96 hours
-
- Green: More than 96 hours
Scientific reference:
Bengtsson H, Ekstrand J, Hägglund M.
Muscle injury rates in professional football increase with fixture congestion: an 11-year follow-up of the UEFA Champions League injury study.
British Journal of Sports Medicine, 2013.
https://doi.org/10.1136/bjsports-2013-092383
Weight in model: 3
This factor is given maximum weight due to:
-
- Longitudinal data across 11 seasons in elite football
-
- Clear association with hamstring and quadriceps injury incidence
-
- Its role as an external, non-modifiable load factor in competition planning
This variable is especially relevant for teams in European competitions or with frequent midweek fixtures.
5. Low Maximal Velocity (Post-Injury)
Why it matters:
After a muscle injury, one of the most sensitive indicators of incomplete recovery is a drop in maximal sprint speed. Even when the player is cleared to return, a persistent decline in peak velocity often signals residual neuromuscular inhibition, tendon stiffness, or protective movement patterns—factors that significantly increase re-injury risk.
This variable evaluates the difference between a player’s pre-injury and post-injury top speed during matches.
Thresholds:
-
- Red: Decrease of more than 0.5 km/h
-
- Orange: Decrease between 0.2 and 0.5 km/h
-
- Green: Decrease less than 0.2 km/h or no decline
Scientific reference:
Pecci C, López-Del Campo R, Resta R, et al.
Return to performance: Machine learning insights into how absence time following muscle injuries affects match running performance in LaLiga soccer players.
Biology of Sport, 2025.
https://doi.org/10.5114/biolsport.2025.151651
Weight in model: 3
This variable is heavily weighted because:
-
- It showed one of the strongest associations with long absence periods post-injury
-
- It reflects real, match-based performance data
-
- It’s easily trackable and meaningful for both medical and technical staff
Velocity loss is not just a number—it’s often a warning sign of incomplete neuromuscular restoration.
6. Muscle Injury Recurrence (Same Type and Location)
Why it matters:
When a player suffers a second injury of the same type, in the same location, the risk profile changes completely. Recurrent injuries are associated with longer recovery times, greater performance loss, and a higher probability of future injuries.
This variable flags players with documented recurrences of previous muscle injuries, particularly when involving the same muscle group and anatomical site.
Thresholds:
-
- Red: One or more recurrences
-
- Orange: Not applicable
-
- Green: No prior recurrences
Scientific reference:
Pecci C, López-Del Campo R, Resta R, et al.
Return to performance: Machine learning insights into how absence time following muscle injuries affects match running performance in LaLiga soccer players.
Biology of Sport, 2025.
https://doi.org/10.5114/biolsport.2025.151651
Weight in model: 3
Recurrent muscle injuries are one of the most robust predictors of future time loss and performance decline, justifying maximum weight in the model.
7. Sprint Count ≥85% Vmax (Post-Injury)
Why it matters:
Returning to sprinting after injury is essential—but not just one sprint. Players must show they can repeat high-intensity efforts above 85% of their maximum velocity, safely and consistently. A clear drop in sprint frequency at high speed is often linked to fear of re-injury, incomplete neuromuscular recovery, or biomechanical compensation.
This variable measures the relative change in number of sprints ≥85% Vmax between pre-injury and post-injury matches.
Thresholds:
-
- Red: Decrease > 40%
-
- Orange: Decrease between 20–40%
-
- Green: Decrease < 20% or stable/increased
Scientific reference:
Pecci C, López-Del Campo R, Resta R, et al.
Return to performance: Machine learning insights into how absence time following muscle injuries affects match running performance in LaLiga soccer players.
Biology of Sport, 2025.
https://doi.org/10.5114/biolsport.2025.151651
Weight in model: 3
The sprint deficit was among the top predictors in the machine learning models used in the study. It’s a sensitive indicator of readiness to compete at full speed.
8. ACTN3 Genotype
Why it matters:
ACTN3 is one of the most studied genes in sports genetics. The XX genotype is associated with lower expression of alpha-actinin-3, a protein critical for fast-twitch muscle function. Multiple studies show that XX players have a higher incidence of muscle injuries and lower capacity for high-intensity efforts under fatigue.
This variable identifies players genetically predisposed to higher injury risk.
Thresholds:
-
- Red: XX genotype
-
- Orange: RX genotype
-
- Green: RR genotype
Scientific reference:
Del Coso J, López-Del Campo R, Resta R, et al.
ACTN3 XX Genotype Negatively Affects Running Performance and Increases Muscle Injury Incidence in LaLiga Football Players.
Genes, 2024.
https://doi.org/10.3390/genes15030386
Weight in model: 3
As a non-modifiable risk factor with strong statistical significance across a full LALIGA season, ACTN3 is given maximum weight in the model. It is especially relevant for high-speed positions and congested calendars.
9. COL5A1 rs12722 Genotype
Why it matters:
The COL5A1 gene encodes for type V collagen, a component that helps regulate fibril formation and connective tissue integrity. In football, the TT genotype of rs12722 has been associated with higher susceptibility to ACL ruptures, especially those occurring without contact and in the early phases of matches. It also shows higher recurrence rates.
This variable identifies players with a genetic predisposition to more severe or recurrent ligament injuries.
Thresholds:
-
- Red: TT genotype
-
- Orange: CT genotype
-
- Green: CC genotype
Scientific reference:
Gómez-Carmona D, Del Coso J, Resta R, et al.
Association Between the COL5A1 rs12722 Genotype and the Prevalence of Anterior Cruciate Ligament Rupture in Professional Football Players.
Genes, 2025.
https://doi.org/10.3390/genes16060649
Weight in model: 3
While genetic, and therefore non-modifiable, this variable is weighted heavily due to its strong association with recurrence and injury pattern severity.
10. H/Q Ratio (Hamstring–Quadriceps Strength)
Why it matters:
An imbalance between hamstring and quadriceps strength—particularly when eccentric hamstring strength is low—has been linked to hamstring strain injuries. This variable captures both concentric strength ratios and eccentric torque levels, using cutoffs based on preseason screening.
Thresholds:
-
- Red: H/Q ratio < 0.505 or eccentric strength < 2.4 Nm/kg
-
- Orange: H/Q ratio 0.505–0.60 or eccentric strength 2.4–2.8 Nm/kg
-
- Green: H/Q ratio > 0.60 and eccentric strength > 2.8 Nm/kg
Scientific reference:
Lee JWY, Mok K-M, Chan HCK, et al.
Eccentric hamstring strength deficit and poor hamstring-to-quadriceps ratio are risk factors for hamstring strain injury in football: A prospective study of 146 professional players.
Journal of Science and Medicine in Sport, 2018.
https://doi.org/10.1016/j.jsams.2017.11.017
Weight in model: 2
This variable is highly modifiable through targeted strength training, which is why it’s given a slightly lower weight. Still, it remains a powerful indicator of injury vulnerability.
11. Metabolic Power Average (MPA – Weekly)
Why it matters:
Metabolic Power Average (MPA) is a GPS-derived indicator that estimates energy expenditure from intermittent accelerations and decelerations. High MPA weeks—especially when sustained over time—have been linked to a higher incidence of non-contact injuries, particularly during congested periods.
This variable reflects the cumulative impact of intense efforts, beyond just distance or speed.
Thresholds:
-
- Red: >13 W/kg
-
- Orange: 10–13 W/kg
-
- Green: <10 W/kg
Scientific reference:
Nobari H, Alves AR, Abbasi H, et al.
Are Metabolic Power Distribution and Accelerometer-Based Global Positioning System Variables Associated With Odds Ratios of Noncontact Injuries in Professional Soccer Players?
Journal of Strength and Conditioning Research, 2023.
https://doi.org/10.1519/JSC.0000000000004475
Weight in model: 2
MPA offers a nuanced view of high-intensity loading. While not a standalone predictor, it adds value when combined with match exposure and ACWR data.
12. Sleep Quality (RESTQ-Sport / PSQI)
Why it matters:
Sleep is a fundamental pillar of recovery. Poor sleep quality—especially when sustained for several days—is associated with increased risk of soft tissue injury, slower tissue repair, reduced neuromuscular readiness, and impaired cognitive response. In elite football, subjective wellness tools like RESTQ-Sport or PSQI offer consistent monitoring of sleep disruptions.
This variable reflects sustained poor recovery status based on reported sleep.
Thresholds:
-
- Red: <6 hours or poor quality >3 consecutive days
-
- Orange: 6–7 hours or moderate sleep quality
-
- Green: ≥7 hours and good sleep quality
Scientific reference:
Laux P, Krumm B, Diers M, et al.
Recovery-stress balance and injury risk in professional football players: a prospective study.
Journal of Sports Sciences, 2015.
https://doi.org/10.1080/02640414.2015.1064538
Weight in model: 2
While sleep is a modifiable and indirect factor, it influences physiological and psychological readiness significantly—justifying its place in the model.
13. Max Deceleration (Post-Injury)
Why it matters:
Post-injury, many players struggle to regain their previous levels of mechanical braking force. A reduction in maximum deceleration is often linked to eccentric strength deficits, protective movement patterns, or tendon-related impairments. This variable highlights players whose in-game deceleration ability remains impaired after return to play.
Thresholds:
-
- Red: >0.2 m/s² drop vs pre-injury
-
- Orange: 0.1–0.2 m/s² drop
-
- Green: <0.1 m/s² drop or stable
Scientific reference:
Pecci C, López-Del Campo R, Resta R, et al.
Return to performance: Machine learning insights into how absence time following muscle injuries affects match running performance in LaLiga soccer players.
Biology of Sport, 2025.
https://doi.org/10.5114/biolsport.2025.151651
Weight in model: 2
Max deceleration was a strong predictor of post-injury underperformance, particularly in long absences. Its high contextual sensitivity makes it especially useful in return-to-play planning.
14. Composite Performance Index (Post-Injury)
Why it matters:
No single metric defines recovery. That’s why this variable aggregates multiple components of physical output—such as acceleration, deceleration, high-speed running, and metabolic load—into a composite index. A drop in this index post-injury reflects a global underperformance compared to pre-injury levels.
Thresholds:
-
- Red: >10% drop from baseline
-
- Orange: 5–10% drop
-
- Green: <5% drop or stable
Scientific reference:
Pecci C, López-Del Campo R, Resta R, et al.
Return to performance: Machine learning insights into how absence time following muscle injuries affects match running performance in LaLiga soccer players.
Biology of Sport, 2025.
https://doi.org/10.5114/biolsport.2025.151651
Weight in model: 2
This global metric avoids overemphasis on isolated variables. It captures the total physiological impact of injury and is especially valuable in borderline cases with mixed signals.
15. Playing Surface
Why it matters:
Playing on artificial turf has been associated with specific biomechanical patterns and altered joint loading. While injury rates are not universally higher on synthetic surfaces, studies suggest an increased risk for ankle sprains and a shift in injury patterns—particularly when exposure is sustained over consecutive matches.
This variable captures cumulative exposure to artificial surfaces, which may amplify mechanical fatigue or change neuromuscular loading.
Thresholds:
-
- Red: Two or more consecutive matches on artificial turf
-
- Orange: One match on artificial or hybrid surface
-
- Green: All matches on natural grass
Scientific reference:
Ekstrand J, Timpka T, Hägglund M.
Risk of injury in elite football played on artificial turf versus natural grass: a prospective two-cohort study.
British Journal of Sports Medicine, 2006.
https://doi.org/10.1136/bjsm.2006.027623
Weight in model: 1
As an environmental and often non-modifiable factor, it carries limited predictive weight, but contributes valuable context when combined with loading variables.
16. Muscle Fiber Typology
Why it matters:
Players with fast-twitch dominant muscle fiber profiles exhibit greater explosiveness but also a higher susceptibility to fatigue and eccentric muscle damage. This biological trait increases the likelihood of hamstring strain injuries, especially in the later stages of matches or during congested fixture periods.
This variable classifies players based on non-invasive muscle fiber profiling via carnosine concentrations.
Thresholds:
-
- Red: Fast-twitch dominant
-
- Orange: Mixed/intermediate profile
-
- Green: Slow-twitch dominant
Scientific reference:
Lievens E, Van Vossel K, Van de Casteele F, et al.
Muscle Fibre Typology as a Novel Risk Factor for Hamstring Strain Injuries in Professional Football (Soccer): A Prospective Cohort Study.
Sports Medicine, 2021.
https://doi.org/10.1007/s40279-021-01538-2
Weight in model: 1
While not modifiable, this genetic trait adds structural context to match exposure and sprint risk, especially in players with explosive roles.
17. Low Chronic Load (Undertrained Status)
Why it matters:
Players with chronically low training volumes may appear “fresh” but are often underprepared for match intensity. These athletes lack the cumulative adaptations that protect against injury under high match demands.
This variable tracks chronic training load trends—typically over a 28-day window.
Thresholds:
-
- Red: Chronic load <70% of team average
-
- Orange: 70–85%
-
- Green: >85%
Scientific reference:
Gabbett TJ.
The training-injury prevention paradox: should athletes be training smarter and harder?
British Journal of Sports Medicine, 2016.
https://doi.org/10.1136/bjsports-2015-095788
Weight in model: 2
This variable complements ACWR and high match exposure to differentiate undertrained players from fatigued ones—an essential distinction in rotation management.
18. Short-Term High-Speed Running Drop (Last 2 Matches)
Why it matters:
A sudden drop in high-speed running (HSR) load—especially in competitive matches—may reflect protective behavior, residual soreness, or latent neuromuscular inhibition. When a player’s HSR volume falls below expected values without tactical justification, it can indicate elevated injury risk.
This variable compares recent HSR to personal baseline.
Thresholds:
-
- Red: HSR < 328 m (match 1) or < 901 m (2-match avg)
-
- Orange: 328–500 m or 901–1300 m
-
- Green: >500 m and >1300 m
Scientific reference:
Moreno-Pérez V, Resta R, Del Coso J, et al.
Reduced Match Exposure in the Previous 2 Matches Accounts for Hamstring Muscle Injury Incidence in Professional Football Players.
Orthopaedic Journal of Sports Medicine, 2023.
https://doi.org/10.1177/19417381231158117
Weight in model: 3
Sudden drops in HSR without training justification often precede soft tissue injury events—especially in fast-twitch profiles or post-injury return phases.
Closing thoughts: from colour to clarity
The purpose of this model was never to create another risk report. It was to offer a system that captures the complexity of injury risk without overwhelming the decision-making process. A model that goes beyond flags to answer the only question that matters: who is truly at risk—and why?
By combining objective variables, weighted scientific evidence, and contextual thresholds, this traffic light no longer oversimplifies. It informs. It explains. And most importantly, it helps guide decisions in the reality of elite football, where every matchday, every sprint, and every minute of load matters.
Risk isn’t a fixed label. It’s a moving target—shaped by genetics, workload, recovery, and context. This model acknowledges that—and transforms it into something actionable.
Whether you’re planning a rotation, managing a return to play, or adjusting the week’s microcycle, this framework is here to support—not replace—your expertise. It’s not about replacing intuition. It’s about reinforcing it with evidence.
If you’d like access to the full scientific references behind any of the 18 variables, feel free to reach out.