
23 Jun Looking Beyond the Goalscoring Table: What Do Goals Really Tell Us?
At the end of every season, one ranking inevitably captures the spotlight: the goalscoring table.
The logic seems straightforward. More goals should mean better attacking performance. But football is rarely that simple. While total goals provide an important starting point, they reveal very little about how those goals were scored, how decisive they were, or whether the players responsible for them excelled in other dimensions of attacking performance.
To explore this question, we analysed every player who scored 10 or more goals during the 2024/25 season in LALIGA EA SPORTS and LALIGA HYPERMOTION.
A total of 47 players met this criterion: 24 in LALIGA EA SPORTS and 23 in LALIGA HYPERMOTION.
It is important to clarify that every statistic, average and comparison presented in this article refers exclusively to this selected group of high-scoring players. The objective is not to compare the two competitions as a whole, but rather to understand the characteristics of the players who successfully reached double figures.
The Top Scorer Doesn’t Dominate Every Category
The first finding appears immediately when we move beyond total goals.
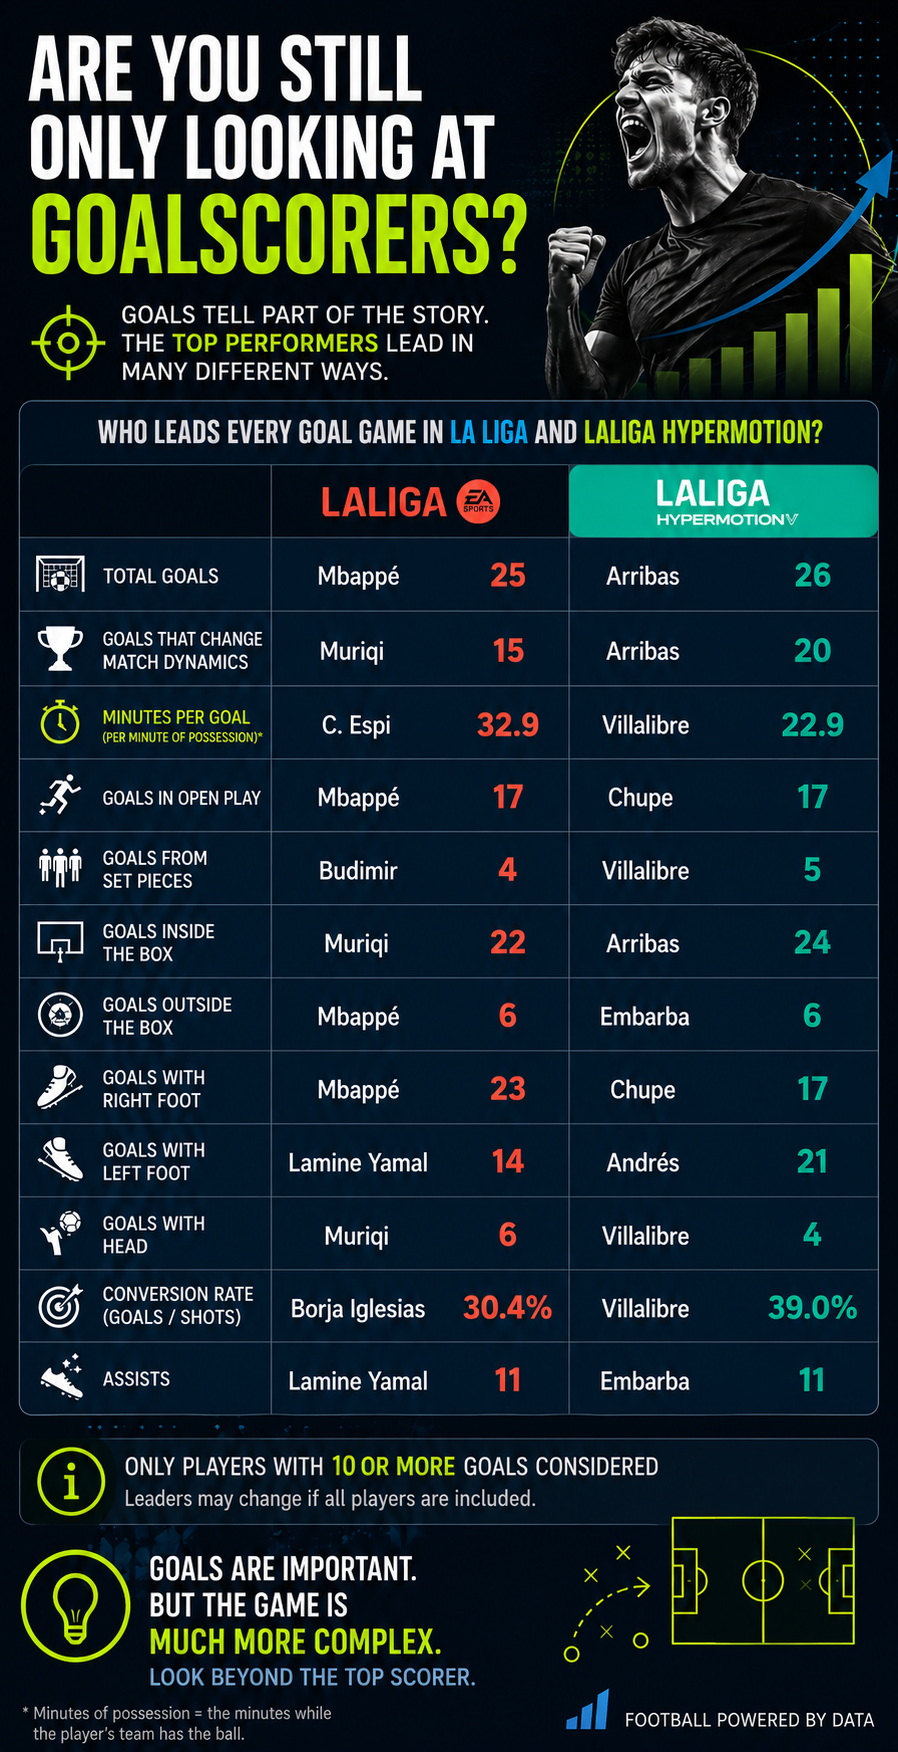
While Kylian Mbappé finished as the leading scorer in LALIGA EA SPORTS with 25 goals and Arribas topped LALIGA HYPERMOTION with 26, neither player dominated every goalscoring category.
| Metric | EA SPORTS Leader | Value | HYPERMOTION Leader | Value |
|---|---|---|---|---|
| Goals | Mbappé | 25 | Arribas | 26 |
| Goals changing scoreline | Muriqi | 15 | Arribas | 20 |
| Possession minutes per goal | C. Espi | 32.9 | Villalibre | 22.9 |
| Open-play goals | Mbappé | 17 | Chupe | 17 |
| Set-piece goals | Budimir | 4 | Villalibre | 5 |
| Goals inside box | Muriqi | 22 | Arribas | 24 |
| Goals outside box | Mbappé | 6 | Embarba | 6 |
| Right-foot goals | Mbappé | 23 | Chupe | 17 |
| Left-foot goals | Lamine Yamal | 14 | Andrés | 21 |
| Headed goals | Muriqi | 6 | Villalibre | 4 |
| Conversion rate | Borja Iglesias | 30.4% | Villalibre | 39.0% |
| Assists | Lamine Yamal | 11 | Embarba | 11 |
The conclusion is simple. Once context is introduced, the concept of «best goalscorer» starts to fragment. Some players score more often, others score more decisive goals, some are more efficient, while others contribute significantly through creativity or aerial dominance.
The Goals That Matter Most
Not every goal changes a match.
Opening the scoring, equalising or putting a team ahead alters the tactical landscape of the game. These moments often have greater competitive value than goals scored when the outcome is already largely decided.
When we rank players according to goals that changed the scoreline, the hierarchy shifts.
In LALIGA EA SPORTS, Muriqi moves ahead of Mbappé despite scoring fewer goals overall. In LALIGA HYPERMOTION, Arribas not only leads total goals but also tops the ranking for match-changing goals, reinforcing his influence on his team’s results.
This is perhaps the clearest example of why context matters. The player who scores the most goals is not always the player whose goals have the greatest impact on match outcomes.
Comparing Elite Goalscorers Across Competitions
The comparison becomes even more interesting when we look at the overall profile of players who reached the 10-goal threshold.
| Metric | EA SPORTS | HYPERMOTION |
|---|---|---|
| Players with 10+ goals | 24 | 23 |
| Average age | 27.9 | 26.5 |
| Average goals | 13.4 | 14.8 |
| Average goals changing scoreline | 8.6 | 10.3 |
| Average assists | 2.5 | 4.2 |
| Possession minutes per goal | 52.0 | 50.7 |
| Conversion rate | 18.8% | 19.7% |
| Goals − xG | +1.78 | +2.67 |
Among players who reached double figures, those in LALIGA HYPERMOTION were younger, scored more goals on average, provided more assists and recorded a higher average overperformance relative to expected goals.
This does not mean that HYPERMOTION is a stronger competition. Rather, it suggests that the profile of players reaching the 10-goal threshold differs between the two leagues.
How Are These Goals Scored?
One of the most striking findings is how similar both competitions are when we examine the characteristics of the goals themselves.
| Goal Distribution | EA SPORTS | HYPERMOTION |
|---|---|---|
| Right foot | 51.9% | 49.4% |
| Left foot | 33.9% | 40.0% |
| Head | 13.7% | 10.6% |
| Inside box | 87.6% | 90.6% |
| Outside box | 12.4% | 9.4% |
| Open play | 69.9% | 68.8% |
| Set pieces* | 11.8% | 11.8% |
*Excluding penalties.
Nearly nine out of every ten goals scored by these players originated inside the penalty area. Despite the popularity of spectacular long-range strikes, elite goalscoring remains overwhelmingly dependent on creating and exploiting opportunities close to goal.
There are, however, subtle differences. HYPERMOTION players scored a larger proportion of their goals with the left foot, while EA SPORTS players recorded slightly more headers and goals from outside the box.
The Number 9 Is Still King
Football has become increasingly fluid over the last decade, with wide forwards, attacking midfielders and inverted wingers taking on greater scoring responsibilities.
Yet among players who reached double figures, the traditional striker remains the dominant profile.
In LALIGA EA SPORTS, 11 of the 24 players were centre forwards, accounting for almost 46% of the sample.
In LALIGA HYPERMOTION, centre forwards represented nearly 48% of all players who scored 10 or more goals.
Despite tactical evolution across the game, the ability of specialist strikers to consistently produce goals remains remarkably resilient.
Beyond Total Goals: Identifying Specialists
Some of the most interesting performers emerge when we analyse metrics that are partially independent of scoring volume.
Alberto Moleiro recorded the highest Goals − xG value in LALIGA EA SPORTS (+4.09), while Chupe led the way in HYPERMOTION (+6.83). These players scored considerably more goals than expected based on the quality of their chances.
Borja Iglesias and Villalibre produced the highest conversion rates in their respective competitions, turning a remarkably high percentage of their shots into goals.
Meanwhile, Muriqi and Villalibre stood out as the leading aerial threats, while Lamine Yamal and Embarba combined goalscoring production with elite creative output through their assist numbers.
These players may not sit at the top of the goalscoring table, but they dominate specific aspects of attacking performance.
Final Thoughts
The goalscoring table remains one of football’s most valuable indicators. Without goals, matches are not won.
However, analysing only total goals risks overlooking many of the qualities that define attacking excellence.
Some players score more frequently. Some score more decisively. Some outperform the quality of the chances they receive. Others contribute through creativity, efficiency or aerial dominance.
The more context we add, the richer the story becomes.
Goals tell us who scored.
Understanding the context behind those goals tells us who performed.