
09 Sep Are players tired—or just reacting to the scoreboard? The truth about second-half performance and effective playing time
A real touchline moment
Minute 72. You’re 0–1 down away from home. GPS shows your full-backs surging; your 9’s sprints are dipping. The analyst whispers “fatigue.” The assistant says “we’re chasing.” Who’s right?
Two peer‑reviewed studies from the Football Intelligence & Performance Department at LALIGA suggest a better answer: both—and it depends on match status and on whether you evaluate performance by total time or by effective (ball‑in‑play) time. Read that again; it changes how we train, report and substitute.
Introduction — Testing two entrenched assumptions
Assumption A: “Players run less in the second half.”
Assumption B: “Running output is independent of the scoreboard.”
We put both to the test in LALIGA with optical tracking (TRACAB via Mediacoach) and large samples of full‑match observations. One study examined how match status (winning/drawing/losing) shapes running by position; the other re‑evaluated the classic second‑half “drop” using effective playing time (ball in play only). The data refine both assumptions—and invite a different coaching mindset: treat the pitch as a living laboratory.
Context from prior work: Apparent second‑half declines can be amplified by more interruptions late in games; when you normalize by effective time, much of the “fatigue story” fades. Earlier research showed that the commonly reported drop is partly a measurement artifact of using total time.
Methods — Same league, complementary lenses (in plain language)
- Competition & tracking: LALIGA, 2018–19; TRACAB (25 Hz) via Mediacoach. Variables: total distance and distance in predefined speed zones (including high‑speed running and sprinting).
- Design 1 (Match status × Position): Players grouped as central/external defenders, central/wide midfielders, and forwards. We modelled how winning, drawing or losing affects each group’s running profile, accounting for location, opposition level and effective playing time.
- Design 2 (Half × Effective time): We compared first vs. second halves per minute of effective play vs per total time, and tested whether any half‑to‑half change depends on position.
Why effective time matters: In elite football, the ball is in play roughly 52–55 minutes and interruptions increase toward the end, biasing total‑time metrics. Normalizing by ball‑in‑play minutes better reflects actual work density.
Results — What the data really say
1) Match status reallocates work by position
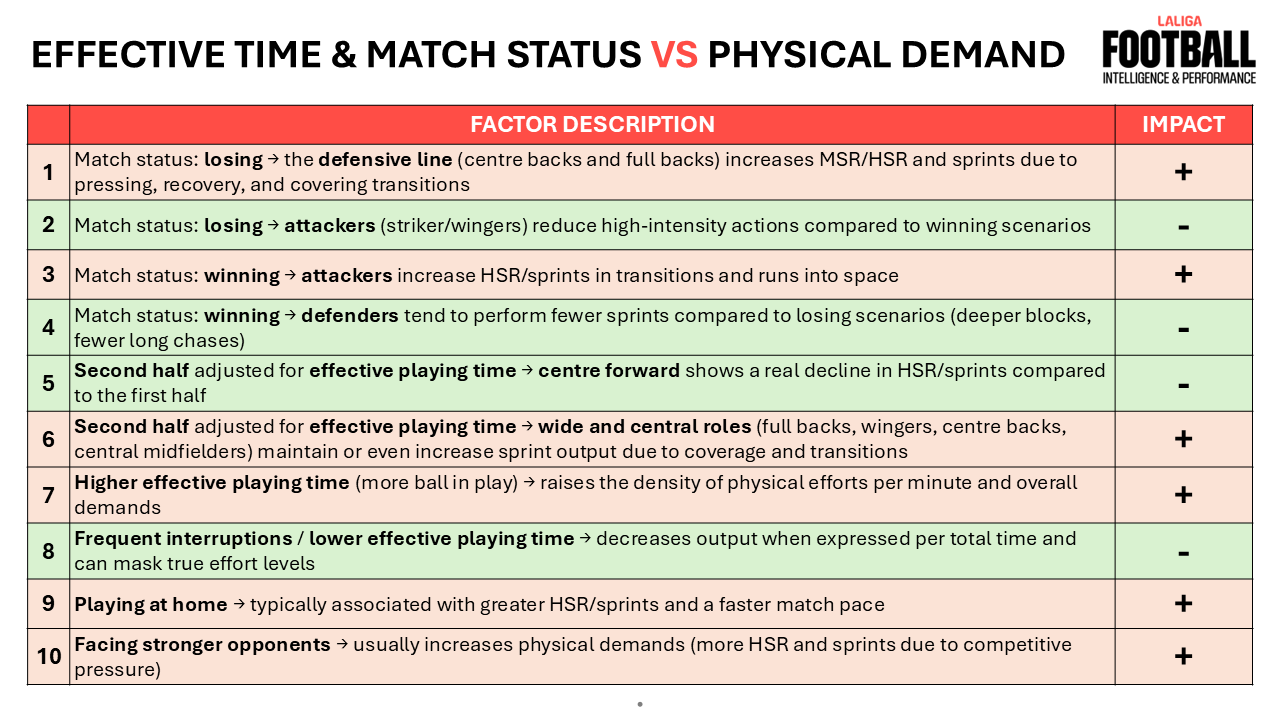
- Defenders (especially full‑backs and centre‑backs) covered more distance at medium/high intensities and sprinting when losing—consistent with pressing, higher lines and recovery runs.
- Attackers (forwards and wide players) tended to show more high‑intensity work when winning—consistent with attacking transitions and exploiting space.
- Central midfielders were comparatively stable across scorelines.
These effects held after accounting for effective time, opponent strength and venue. Practical meaning: the scoreboard tilts the physical profile by role.
2) The second‑half “drop” largely disappears with the right denominator
Across positions, high‑speed running and sprints per minute of effective play showed no meaningful decline from first to second half. The familiar dip appears when you divide by total time (which includes longer stoppages later in games). Translation: much of the perceived late‑game decline is structural (game management), not purely physiological.
This aligns with independent evidence showing that when effective time is considered, the second‑half drop shrinks substantially.
3) One exception you should plan for: the 9
Forwards did show a real second‑half reduction in HSR and sprinting even per effective minute, while external defenders and wide midfielders maintained their outputs and central roles often spiked late‑game sprinting. Implication: substitution timing and late‑game conditioning should be position‑specific, not generic.
Discussion — What this changes on the training pitch and in the meeting room
1) Read the game through two lenses: status × effective time
A full‑back’s “surge” when losing is not a mistake; it’s a tactical signature. A striker’s late drop is not only “fatigue”; it may reflect role demands under specific states (deep block ahead, fewer breakaways). If you report halves only by total minutes, you may conflate interruption patterns with performance. Pair every report with ball‑in‑play metrics.
Why we’re confident: Multiple leagues and tournaments have shown that interruptions rise late and that effective‑time normalization changes conclusions about “fatigue.”
2) Integrate with what was already known—and refine it
Classic work linked late‑match reductions to fatigue, pacing and context; our results do not deny fatigue, but re‑portion its role by showing how measurement choice and match status shape the picture. Use both insights: design conditioning and manage the match.
Practical applications — From evidence to action
A) Reporting & interpretation
- Always include effective‑time KPIs (m·min⁻¹ in ball‑in‑play) alongside totals.
- Tag each interval with match status and venue; interpret outliers through those contexts.
- When a “drop” appears, ask first: Is this total‑time or effective‑time? If total‑time only, you may be chasing a phantom.
B) Training design (position‑specific)
- Forwards (9/7/11): Build repeated‑sprint ability windows after minute 60 in MD‑3/MD‑2; rehearse late pressing triggers with short rest to mirror reduced second‑half HSR in effective play. Plan earlier, data‑led substitutions for the 9 when penetration or first‑line pressure wanes.
- External defenders & wide midfielders: Maintain “cruise‑then‑burst” profiles with restart‑dense games (throw‑ins/free‑kicks) to simulate real second‑half rhythm where they still need to hit HSR/sprints.
- Central defenders/CMs: Prepare for late reactive sprints (cover, counters, box defence). Include compact‑to‑press transitions after minute 70 when interruptions extend recovery windows.
C) Match operations & substitution logic
- Combine status‑aware reading (who’s chasing? who’s protecting?) with effective‑time dashboards before deciding it’s “fitness.”
- If losing, anticipate defensive line workload spikes; structure in‑game rotation or support (e.g., fresh wide legs). If winning, monitor attackers’ HSR for counter threats; use role‑based swaps rather than uniform “energy” subs.
D) Scenario planning for staff briefings
- Prepare two “what‑if” cards for each role: Winning Plan (attackers as sprinters; defenders as controllers) vs Losing Plan (defenders as chasers; attackers as facilitators). Anchor each to effective‑time rates, not just totals.
Limitations — What this doesn’t claim
- One league/season context; replication across styles and competitions is welcome.
- Analyses used 90‑minute players; substitute dynamics require dedicated study.
- No direct lab fitness measures in these datasets; linking individual capacity to late‑game roles is a next step.
These caveats don’t weaken the central coaching message: how you normalize and what the scoreboard says both shape what your data means.
Conclusions — Coach with disciplined curiosity
The data refine two common beliefs. First, much of the second‑half “decline” is measurement, not just fatigue. Second, match status redistributes work by position in predictable ways. Embrace a lab mindset: question the denominator, read the scoreboard, and test your assumptions on the grass. This is how applied science becomes competitive advantage.
Research & further reading
- Do elite soccer players cover longer distance when losing? Differences between attackers and defenders (https://doi.org/10.1177/1747954120982270)
- Elite Soccer Players do Not Cover Less Distance in the Second Half of the Matches When Game Interruptions Are considered (https://doi.org/10.1519/JSC.0000000000003935)