
20 Ene When the Game Demands More, Maximum Speed Declines
A consistent second-half pattern in professional football
There is a widespread assumption in football.
As matches progress and results are on the line, players are expected to reach their highest physical levels. More intensity. More effort. More speed.
From a tactical and emotional perspective, this assumption is logical.
From a performance and physiological perspective, the data suggests otherwise.
Using complete match data from LALIGA EA Sports 2024/25 (38 matchdays), an internal investigation conducted by the Football Intelligence & Performance Department at LALIGA identified a robust and consistent pattern:
Maximum speed decreases from the first half to the second half of matches.
This decrease appears systematically and cannot be explained by age, playing position, or team context.
How the analysis was designed
The objective was not to describe match volume or effort, but to isolate how maximum speed is actually expressed during competition.
To do so, the analysis followed three key principles:
- Comparisons were made player by player and match by match
- Only players with valid maximum speed values in both halves were included
- First- and second-half values were compared within the same match context
This design avoids common confounders such as effective playing time, tactical exposure, or substitutions. It focuses exclusively on what happens when players do reach high-speed values.
The primary finding: a lower second-half speed ceiling
Across the entire dataset, players reached lower maximum speeds in the second half.
Additionally, this pattern was consistent when maximum speed was examined:
- as a global value
- and across different sprint distances (10, 20, 40 and 60 meters)
The magnitude of the reduction was modest but highly systematic. This is not a collapse in performance. It is a reliable downward shift in the upper limit of speed expression.
Importantly, this pattern remained:
- across all age groups
- across all teams
- across all playing positions
Only the magnitude of the decline varied slightly by position. The direction did not.
Players still sprint — but with a lower ceiling
A key nuance is often missed.
This pattern does not mean players stop sprinting in the second half. In fact, a substantial proportion of players still reach their highest match speed after halftime.
What changes is not intent, effort, or tactical urgency.
What changes is the probability of reaching the absolute speed ceiling.
Maximum speed expression becomes less consistent as the match progresses.
Testing a critical methodological question: are we looking at outliers?
Maximum values are often criticised for being sensitive to isolated events. A single exceptional sprint can dominate interpretation.
To address this, an additional step was taken.
For each player, we calculated:
- the average of their match maximum speeds in the first half
- and the average of their match maximum speeds in the second half
This shifts the question from:
What was the single highest speed?
to:
What is the typical maximum speed this player reaches across matches?
The result: the pattern not only remains, it strengthens
When analysing these player-level averages of maximum speed, the outcome was unequivocal.
- The average of maximum speeds was lower in the second half
- The difference was statistically significant
- The magnitude of the effect was moderate, not trivial
On average, players showed a reduction of approximately 0.6 km/h in their typical maximum speed ceiling from the first to the second half.
This is a critical finding. It demonstrates that the second-half decline:
- is not driven by rare or extreme sprints
- reflects a stable and repeatable behavioural pattern
The phenomenon does not disappear when extreme values are smoothed. It becomes clearer.
Why age, position, and team do not explain the decline
Several common assumptions were tested explicitly.
Age
The decline was present across all age groups. Younger players did not systematically maintain higher maximum speeds. Older players did not show a disproportionate drop.
Playing position
Some modulation existed. Defenders and central midfielders showed smaller declines. Attacking roles showed larger ones. However, no position escaped the pattern.
Team context
No meaningful differences were observed between teams. Playing style, tactical dominance, or competitive context did not explain the effect.
Together, these results indicate that the decline in maximum speed is structural, not contextual.
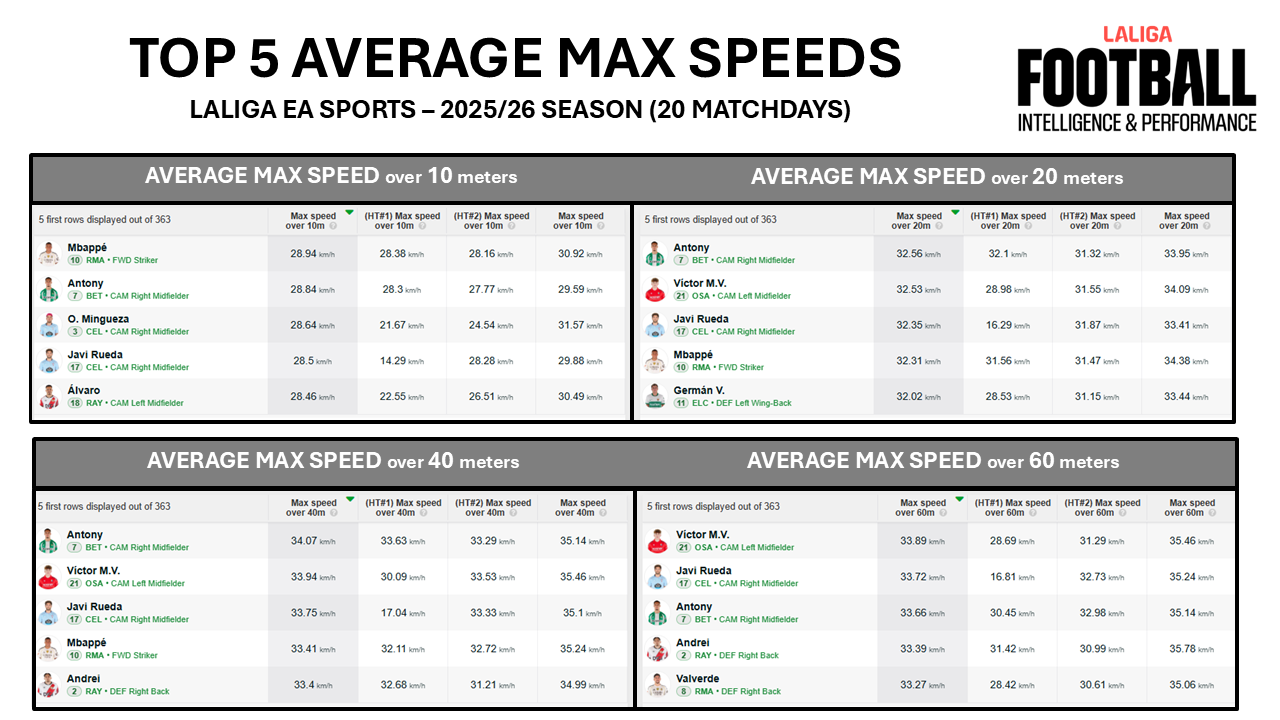
How the accompanying visual fits into the analysis
The accompanying graphic is intentionally illustrative.
By showing average maximum speeds across different distances using current-season examples (LALIGA EA Sports 2025/26, first 20 matchdays), it highlights an applied reality:
Reaching maximum speed depends on having sufficient distance and space.
Most football sprints are short. Not every high-intensity action allows players to approach their true speed ceiling. This helps explain why maximum speed expression is probabilistic, especially under accumulated match demands.
The graphic does not replace the main finding.
It helps practitioners interpret it correctly.
Practical implications for coaches and performance staff
Several conclusions follow directly:
- Maximum speed should not be treated as a fixed personal trait
- A second-half reduction does not imply reduced effort or commitment
- Single maximum values, without context, can be misleading
Understanding how often, when, and under what conditions maximum speed can be expressed is far more informative than focusing on isolated peaks.
Final message
This investigation identifies a clear and consistent pattern in professional football:
Both extreme and typical maximum speed values are lower in the second half of matches, independently of age, team, or playing position.
Recognising this pattern does not limit performance analysis.
It makes it more precise.
Because progress in football, as in science, starts by testing assumptions — not repeating them.