
16 Oct We Always Said Physical Data Don’t Predict Success. Until Now.
For the first time, a physical metric mirrors the league table itself.
The Assumption We All Shared
Every coach, analyst and physical trainer has repeated it countless times:
“Physical data don’t explain who wins football matches.”
And for years, the evidence backed that up.
Running more metres — total, above 21 km/h or 24 km/h — rarely correlated with results.
The best teams weren’t necessarily the ones who covered the most distance.
Until now.
Because this season, using official tracking data from LALIGA EA Sports 2024/25, we found a metric that does align with success — not because it measures how much a team runs, but because it measures how much it makes its rivals run.
That metric is the Rival Exertion Index (IER).
What the IER Really Measures
The Football Intelligence & Performance Department at LALIGA designed the IER to answer a deceptively simple question:
“Who carries the physical cost of the match — you or your opponent?”
It compares two official LALIGA tracking datasets:
- How much each team runs (with / without possession).
- How much their rivals run when facing them.
Then two equations reveal the “hidden” side of dominance:
- IER – rival without possession = (m/min of the rival defending) − (m/min of the team attacking)
→ How much your attacks make the opponent defend. - IER – rival with possession = (m/min of the rival attacking) − (m/min of the team defending)
→ How much your defence makes the rival work while they have the ball.
Positive IER ⇒ the rival works more per minute → you control the game’s physical tempo.
Negative IER ⇒ you do the extra work.
It’s not about distance; it’s about who dictates who runs.
When Physical Data Finally Matched Sporting Reality
For the first time, the physical rankings matched the league table.
The two teams that led LALIGA EA Sports 2024/25 — Real Madrid (champion) and FC Barcelona (runner-up) — also lead the IER rankings across multiple metrics.
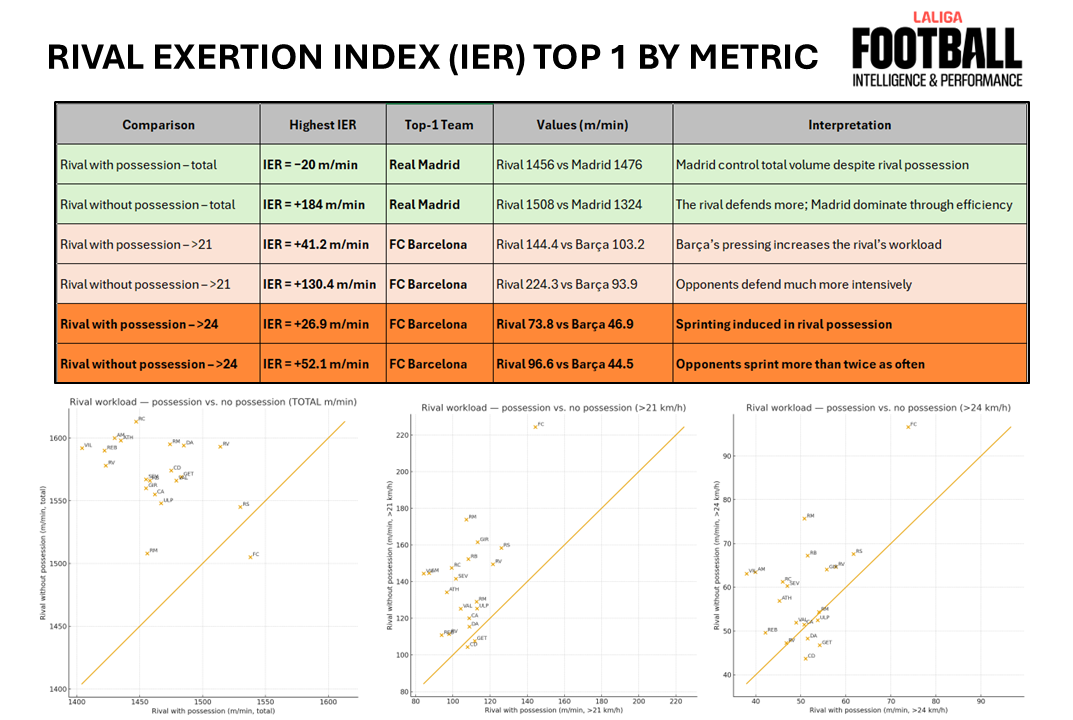
Summary Table — Rival Exertion Index (IER) Top 1 by Metric
| Comparison | Highest IER | Top-1 Team | Values (m/min) | Interpretation |
|---|---|---|---|---|
| Rival without possession – total | IER = +184 m/min | Real Madrid | Rival 1508 vs Madrid 1324 | The rival defends more; Madrid dominate through efficiency |
| Rival without possession – >21 | IER = +130.4 m/min | FC Barcelona | Rival 224.3 vs Barça 93.9 | Opponents defend much more intensively |
| Rival without possession – >24 | IER = +52.1 m/min | FC Barcelona | Rival 96.6 vs Barça 44.5 | Opponents sprint more than twice as often |
| Rival with possession – >21 | IER = +41.2 m/min | FC Barcelona | Rival 144.4 vs Barça 103.2 | Barça’s pressing increases the rival’s workload |
| Rival with possession – >24 | IER = +26.9 m/min | FC Barcelona | Rival 73.8 vs Barça 46.9 | Sprinting induced in rival possession |
| Rival with possession – total | IER = −20 m/min | Real Madrid | Rival 1456 vs Madrid 1476 | Madrid control total volume despite rival possession |
All Top 5 Rankings — Season 2024/25
IER – Rival Without Possession (Defending Against You)
TOTAL (m/min)
| Rank | Team | IER | Rival Def. | Team Att. |
|---|---|---|---|---|
| 1 | Real Madrid | +184 | 1508 | 1324 |
| 2 | Real Betis | +137 | 1566 | 1429 |
| 3 | Athletic Club | +127 | 1598 | 1471 |
| 4 | CD Leganés | +124 | 1574 | 1450 |
| 5 | Sevilla FC | +121 | 1567 | 1446 |
Top 1 – Real Madrid: Rivals defending Madrid’s attacks run +184 m/min more. They dominate through physical efficiency — less internal effort, more external cost.
> 21 km/h
| Rank | Team | IER | Rival Def. >21 | Team Att. >21 |
|---|---|---|---|---|
| 1 | FC Barcelona | +130.4 | 224.3 | 93.9 |
| 2 | Girona FC | +78.5 | 161.5 | 83.0 |
| 3 | Real Madrid | +76.6 | 173.8 | 97.2 |
| 4 | Real Sociedad | +56.8 | 158.4 | 101.6 |
| 5 | Real Betis | +47.3 | 152.3 | 105.0 |
Top 1 – FC Barcelona: Opponents defend at +130 m/min >21 km/h. Barça’s positional play stretches blocks and triggers high-intensity defensive effort.
> 24 km/h
| Rank | Team | IER | Rival Def. >24 | Team Att. >24 |
|---|---|---|---|---|
| 1 | FC Barcelona | +52.1 | 96.6 | 44.5 |
| 2 | Girona FC | +30.2 | 64.0 | 33.9 |
| 3 | Real Madrid | +26.8 | 75.7 | 48.9 |
| 4 | Real Sociedad | +20.2 | 67.6 | 47.3 |
| 5 | Real Betis | +16.1 | 67.2 | 51.1 |
Top 1 – FC Barcelona: Rivals sprint +52 m/min >24 km/h defending Barça — technical control that forces explosive effort.
IER – Rival With Possession (Attacking Against You)
TOTAL (m/min)
| Rank | Team | IER | Rival Att. | Team Def. |
|---|---|---|---|---|
| 1 | Real Madrid | −20 | 1456 | 1476 |
| 2 | CD Leganés | −63 | 1475 | 1538 |
| 3 | RCD Mallorca | −73 | 1474 | 1547 |
| 4 | CA Osasuna | −75 | 1462 | 1537 |
| 5 | Real Valladolid CF | −86 | 1423 | 1509 |
Top 1 – Real Madrid: Even when the rival attacks, Madrid’s defensive structure keeps the workload lower (−20 m/min). They control the game’s total volume.
> 21 km/h
| Rank | Team | IER | Rival Att. >21 | Team Def. >21 |
|---|---|---|---|---|
| 1 | FC Barcelona | +41.2 | 144.4 | 103.2 |
| 2 | Real Madrid | +17.3 | 107.2 | 89.9 |
| 3 | Girona FC | +3.3 | 113.3 | 110.0 |
| 4 | Real Betis | −15.4 | 108.3 | 123.7 |
| 5 | RC Celta | −17.5 | 99.4 | 116.8 |
Top 1 – FC Barcelona: Rivals with the ball accelerate +41 m/min >21 km/h. Barça’s pressure makes possession physically costly.
> 24 km/h
| Rank | Team | IER | Rival Att. >24 | Team Def. >24 |
|---|---|---|---|---|
| 1 | FC Barcelona | +26.9 | 73.8 | 46.9 |
| 2 | Girona FC | +10.2 | 55.8 | 45.6 |
| 3 | Real Madrid | +9.9 | 50.8 | 40.9 |
| 4 | Real Betis | +0.3 | 51.5 | 51.3 |
| 5 | RC Celta | −0.3 | 46.0 | 46.3 |
Top 1 – FC Barcelona: When rivals attack, they sprint +27 m/min >24 km/h. Barça turn defending into a trigger for rival sprinting.
What This Reveals
For the first time, a physical metric correlates with competitive success.
The IER doesn’t reward who runs more — it rewards who controls who runs.
- Real Madrid → Efficiency: dominate without overworking.
- FC Barcelona → Structure: make others sprint for your control.
- Both translate tactical dominance into physical asymmetry — and that’s exactly what shows up in the IER tables.
Why It Matters
- Performance insight: IER quantifies the physical footprint your game model leaves on the rival.
- Training relevance: design sessions that replicate imposed workload, not only internal load.
- Scouting value: identify styles that dominate through physical efficiency.
- Scientific bridge: for the first time, physical and competitive data align.
Final Reflection
Football isn’t won by who runs the most.
It’s won by who makes the other team run more — and smarter.
The Rival Exertion Index (IER) reveals the unseen side of dominance: controlling the rival’s energy budget.
That’s why the teams lifting trophies are also topping these charts.