
04 Feb Stretch Index and Distance to the Ball: The Model Revealing How Top LALIGA EA Sports Teams Organize Differently from the Rest
From LALIGA’s Football Intelligence & Performance Department, we have developed an innovative model to understand how teams organize themselves on the pitch based on their performance. Using data from LALIGA EA Sports (2023/24 season), we combined two key spatial metrics:
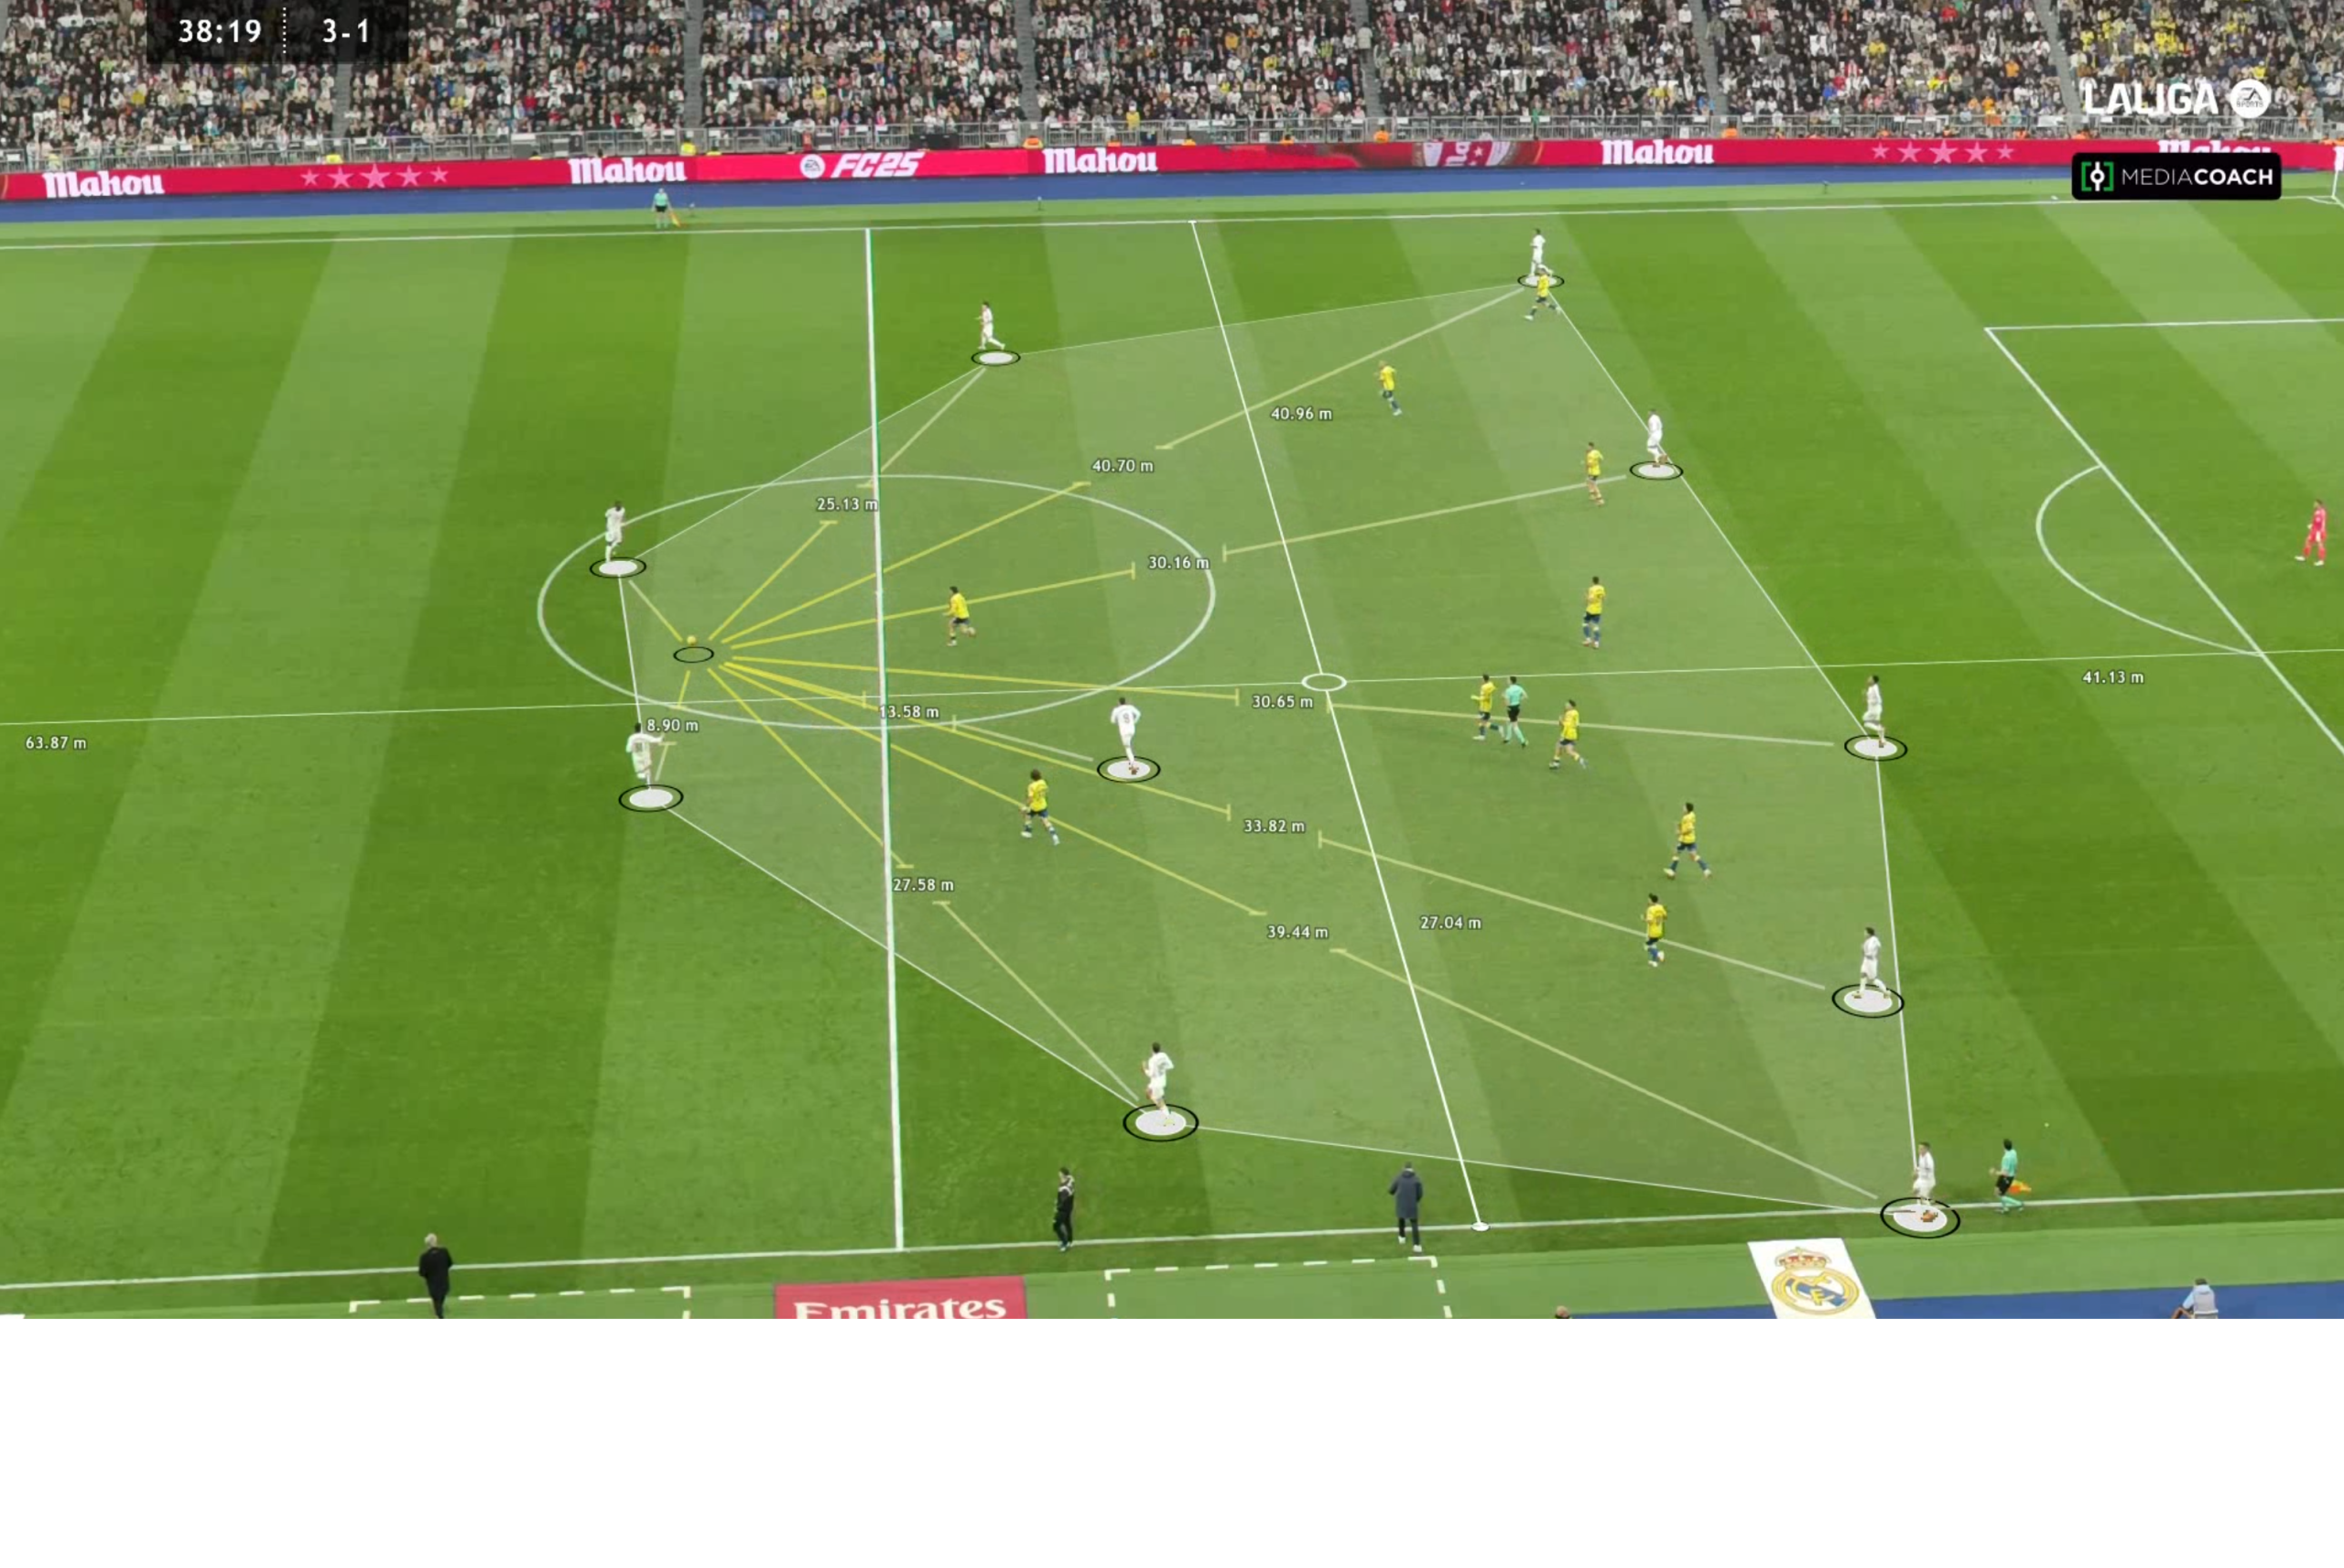
✅ Stretch Index → Measures how spread out or compact players are in relation to the team’s centroid.
✅ Distance to the Ball → Evaluates how close each player is to the ball in different phases of play.
The objective is twofold:
? Identify differences between top teams and the rest.
⚽ Provide practical applications for improving training and tactical planning.
? Key Findings: How Teams Organize Themselves Based on Performance
1️⃣ Top Teams Play with More Width in Attack
? Statistically significant difference in stretch index in attack (p < 0.001, ANOVA and Tukey post-hoc test).
- Champions Group teams show significantly higher values than Mid-Table and Relegation Group teams.
- Top teams maximize width to create space and stretch defensive structures.
➡ Practical Application:
✔ Design possession and positional play drills where players maintain width without disconnecting from the ball.
✔ Ensure that wingers and full-backs maintain optimal spacing while staying involved in play.

2️⃣ Defensive Compactness Is Not Enough
? Statistically significant difference in stretch index in defense (p < 0.001, ANOVA and Tukey post-hoc test).
- Top teams defend in a more expansive shape, particularly when pressing high.
- Relegation Group teams tend to stay compact, but this does not always translate to better defensive efficiency.
➡ Practical Application:
✔ High-pressing teams should maintain defensive width to close passing lanes.
✔ Teams opting for a low block must balance compactness with proximity to the ball to avoid being pinned back.

3️⃣ Top Teams Organize Differently in Defensive Transitions
? Statistically significant difference in stretch index in transition to defense (p < 0.001, ANOVA and Tukey post-hoc test).
- Champions Group teams show higher values, suggesting they press aggressively after losing possession rather than immediately dropping back.
- Relegation Group teams tend to retreat quickly, which can leave them vulnerable to fast attacks.
➡ Practical Application:
✔ In training, emphasize counter-pressing drills where players close the distance to the ball immediately after losing it.
✔ Prevent defensive lines from becoming too stretched, leaving gaps for the opposition.

4️⃣ Progression and Build-Up Phase Distinguish Top Teams
? Statistically significant difference in stretch index in progression and build-up phase (p < 0.001, ANOVA and Tukey post-hoc test).
- Top teams play with greater width during build-up and progression, creating more passing lanes and facilitating ball circulation.
- In contrast, Relegation Group teams maintain a more compact structure, limiting their offensive capacity.
➡ Practical Application:
✔ Train wide but controlled build-up play, ensuring passing options remain available without excessive player separation.
✔ Reinforce support movements in teams struggling with progression to avoid losing passing options.


? The Innovation: Combining Stretch Index with Distance to the Ball
While the stretch index provides valuable insights into team structure, adding distance to the ball helps us understand how players interact with play in each phase.
The data shows that top teams not only play with more width but also keep more players connected to the ball throughout the game.
? A team can be highly stretched, but if players are too far from the ball, circulation becomes ineffective.
? In defense, compactness alone is not enough; players must also be close to the ball to press effectively.
? In offensive transitions, teams that close the distance to the ball quickly after recovering possession create more attacking threats.
➡ Practical Application:
✔ Design training sessions that emphasize not just width, but also player proximity to the ball depending on the game context.
✔ Evaluate how players position themselves in counter-pressing situations to ensure that defensive structure is both compact and effective in relation to the ball.
? Methodology
This study analyzed 380 matches from the LALIGA EA Sports 2023/24 season. Teams were classified into four groups based on their final league position:
- Champions Group → Top four teams.
- Europa Group → Teams ranked 5th to 7th.
- Mid-Table Group → Teams ranked 8th to 17th.
- Relegation Group → Bottom three teams.
Stretch index values were measured across the following phases of play:
✔ Attack
✔ Defense
✔ Progression
✔ Build-up
✔ Transition to defense
A one-way ANOVA test was conducted to compare metrics between groups, followed by a Tukey post-hoc test to identify specific differences.