
18 Feb The Big Lie About Possession: It’s Not Just Time, It’s How You Use It
Does more possession mean better attacking? Yes, but not for the reasons you think.
For years, the debate around possession has revolved around a simple idea: more possession equals more control of the game and more goals. However, our analysis reveals that this relationship is not so straightforward. Teams with more possession not only have more of the ball, but they also use it differently, and that is the key to their offensive success.
1. More possession, more attack… but with intelligence
Teams with more possession generate a higher offensive volume than those with less possession:
- More total shots.
- More shots on target.
- More scoring chances.
- More goals.
However, this relationship is not linear. Among the middle quartiles (Q2 and Q3), the differences are not as pronounced. The big leap occurs between teams with the most and least possession. This indicates that the key is not just having more of the ball, but how you use it.
2. Possession and efficiency: The myth of endless touches
More possession does not necessarily mean teams are more effective at finishing. Analyzing offensive efficiency reveals that:
- There are no differences in shots on target per goal. Accuracy in finishing does not depend on possession.
- There are differences in total shots per goal and scoring chances per goal. Teams with less possession need more overall attempts to score, suggesting their shots are of lower quality.
Therefore, teams with more possession are not necessarily better finishers, but they do create higher-quality attacks and are more selective with their shots.
3. The secret lies in game rhythm, not just ball time
Possession is not just a matter of time; it’s about the rhythm of the game. When we analyze how teams use the ball based on their possession levels, we find crucial differences:
- Teams with more possession play more slowly and in a more structured way:
- Fewer short possessions per minute.
- More long possessions per minute.
- More medium possessions.
- Teams with less possession play faster and more directly:
- More short possessions.
- Fewer long possessions.
- Fewer medium possessions.
The problem for teams with little possession isn’t just that they have less of the ball, but that they manage it in a more rushed and less controlled manner. It’s not about how much of the ball you have, but how you use it.
Team Profiles by Ball Management
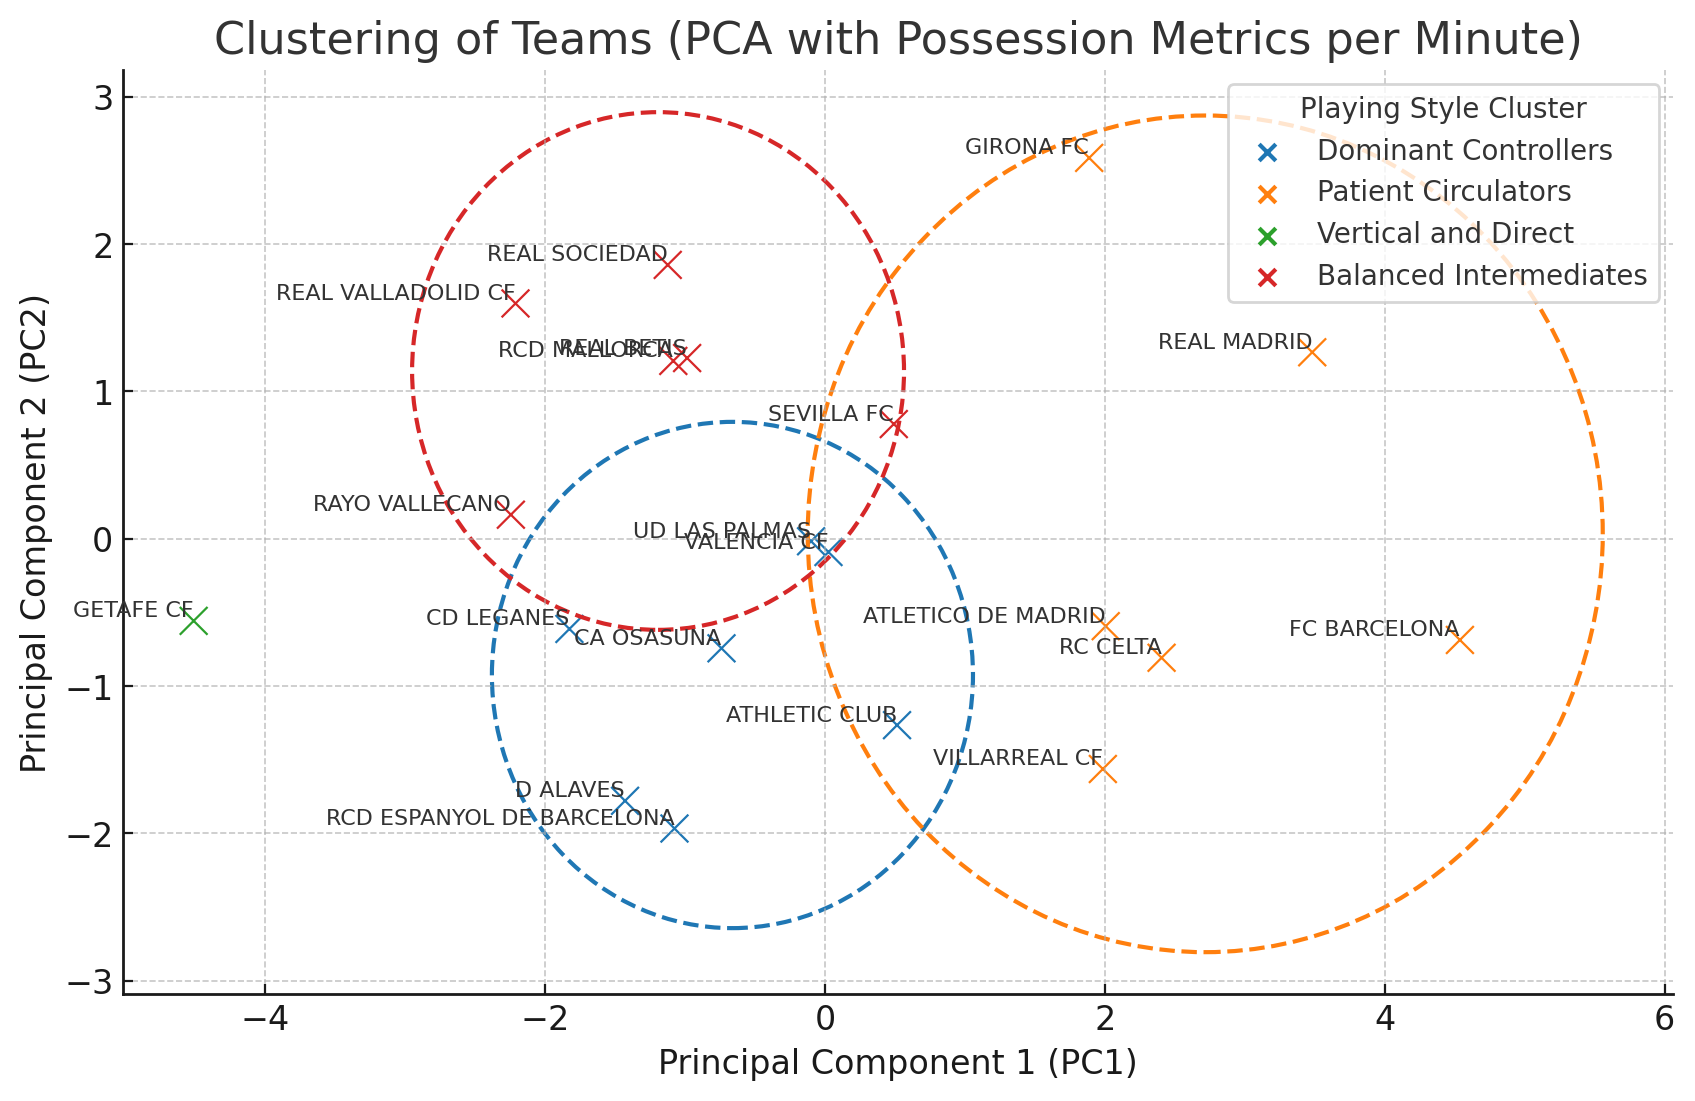
To better understand playing styles, a clustering analysis was conducted based on possession metrics per minute, removing the effect of total volume. This analysis identifies distinct team profiles:
1. Patient Circulators
Teams that handle the ball calmly, avoiding quick losses and building play in a structured manner. They don’t generate many possessions per minute, but each possession is well-crafted and effective.
- Total teams in this group: 6
- Example teams: Atlético de Madrid, FC Barcelona, Girona FC, RC Celta, Real Madrid, Villarreal CF
2. Vertical and Direct
Teams that prioritize speed in offensive transitions. They have many short possessions and few long possessions, indicating a faster, more direct style of play. However, their offensive production is less efficient than other profiles.
- Total teams in this group: 1
- Example teams: Getafe CF
3. Balanced Intermediates
Teams that don’t fully dominate possession but seek a balance in ball circulation. Their attacks combine controlled phases with moments of rapid transitions, without being entirely vertical.
- Total teams in this group: 6
- Example teams: Rayo Vallecano, RCD Mallorca, Real Betis, Real Sociedad, Real Valladolid CF, Sevilla FC
4. Dominant Controllers
Teams that combine high offensive efficiency with structured control of the game. They aim to maintain possession at a moderate, balanced pace, avoiding slow circulation or overly direct play.
- Total teams in this group: 7
- Example teams: Athletic Club, CA Osasuna, CD Leganés, D Alavés, RCD Espanyol de Barcelona, UD Las Palmas, Valencia CF
Methodology of the Analysis
This analysis was based on data from LaLiga EA Sports teams, using aggregated metrics per match normalized per minute of possession to avoid biases due to total time with the ball. The following procedures were used:
- Quartile Analysis: Teams were segmented into four groups based on their average possession minutes per match.
- Statistical Tests: ANOVA tests and Tukey post-hoc comparisons were conducted to identify significant differences among quartiles in various offensive and possession management metrics.
- Clustering: K-means clustering was applied to metrics per minute of possession to identify groups of teams with similar playing styles. The optimal number of clusters was determined using the elbow method.
- Dimensionality Reduction (PCA): To visualize the clustering results, Principal Component Analysis (PCA) was employed, enabling two-dimensional representation of teams’ playing patterns.