
25 Sep Using Heatmaps to Analyze Key Events: Preparing for Your Next Opponent
As a coach, preparing for an upcoming match means not just understanding your team, but also gaining insights into your opponent. One of the most effective tools at your disposal is the use of heatmaps to analyze key events. This approach allows you to see where on the pitch your opponent has been most active in recent matches. Here’s how you can use heatmaps to analyze critical events from your opponent’s last five matches, and how that data can help refine your game plan.
Analyzing Key Events Through Heatmaps
When analyzing your next opponent, it’s common practice to look at key events like sprints, offensive and defensive actions, crosses into the box, ball recoveries, and shots on goal. By mapping these events, you can understand where your rival tends to perform these actions and identify potential areas to exploit or guard.
For example:
- Sprints: Knowing where your opponent tends to sprint can reveal high-intensity zones. Are they pressing high up the pitch, or are their sprint efforts concentrated in defensive recovery situations?
- Offensive actions: By mapping their offensive plays, such as crosses or dribbles, you can see whether they focus their attacks on one side or if they prefer to spread their play.
- Defensive actions: Analyze where the opponent performs most of their tackles and ball recoveries. This can help you plan how to bypass their defensive strengths.
- Crosses and Aerial Duels: If your opponent relies heavily on crosses and aerial duels, identifying the key zones where these happen will guide you in organizing defensive cover and aerial strength in those areas.
- Attacking Interruptions: Seeing where they often intercept the ball can help you avoid those areas when building up your play.
Each of these insights gives you a tactical advantage to target their weaknesses and protect your team from their strengths.
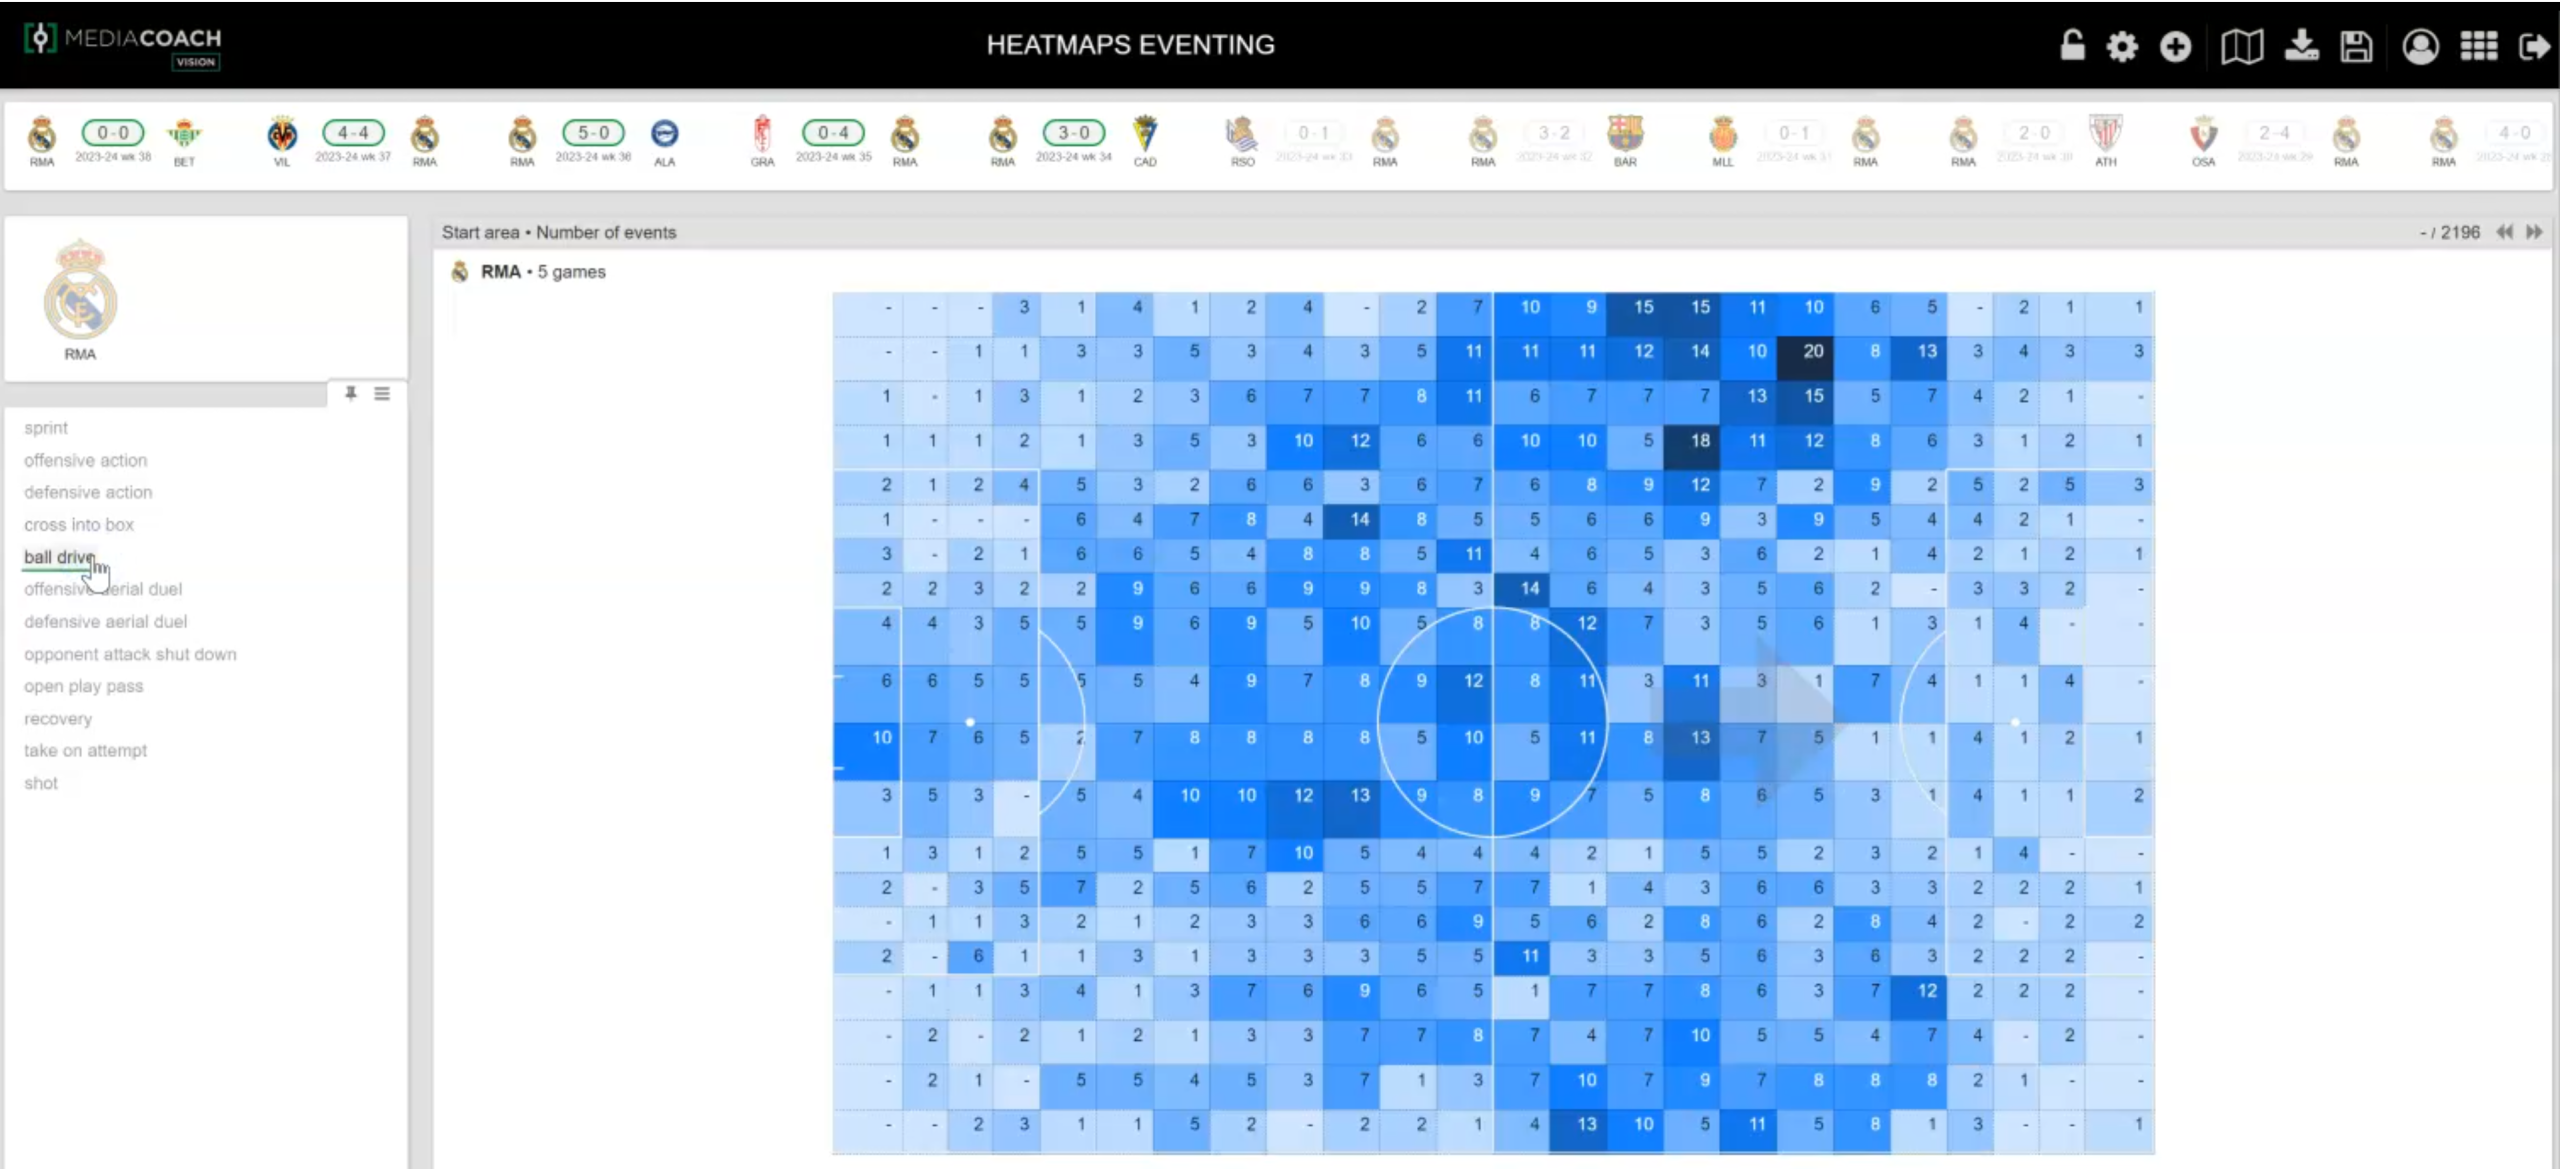
Heatmaps for Starting and Ending Zones
In most analyses, heatmaps are typically generated based on the starting zone of an event (e.g., where the player starts a dribble or initiates a pass). However, for certain events, such as passes, it can be extremely valuable to create a heatmap for both the starting zone and the ending zone. By comparing these heatmaps, you gain a clearer understanding of not just where passes are initiated but also where they are intended to end.
For example, mapping both the start and end of passes can reveal whether your opponent favors long balls into certain areas or if they build attacks gradually through short, precise passing in midfield. It can also show patterns in their final third play, such as heavy reliance on certain players or sides for dangerous balls into the box.
Global vs. Individual Analysis
This heatmap analysis can be done in two ways: at a global team level or focusing on individual players.
- Team-Level Analysis:
- Creating a cumulative heatmap based on the entire team’s actions across the last five matches provides a macro view of their tendencies. You’ll get a good sense of where they generate pressure, their preferred build-up zones, and where they tend to win or lose the ball.
- A team-level heatmap might show, for instance, that your opponent consistently attacks down the right flank and creates numerous crosses from that area. With this knowledge, you can adjust your defensive line accordingly.
- Individual Player Analysis:
- Focusing on specific players allows you to see their zones of influence for particular events. For example, if an opponent’s left winger is heavily involved in crossing, a heatmap of their crosses might show that they prefer to deliver balls into the box from a specific part of the pitch.
- Analyzing an individual player’s dribbles, tackles, or passes helps you prepare for how to mark them more effectively or exploit gaps they may leave.
Match-by-Match or Over Several Matches?
This analysis can be tailored to look at individual matches or a group of matches:
- Single-match analysis helps you understand your opponent’s performance in a specific game, which can be particularly valuable if that game was against a team with a similar style to yours.
- Multi-match analysis allows you to see patterns and trends over time, providing a broader view of their tactical approach and how consistent they are in certain aspects of their play.
Conclusion: Heatmaps as Tactical Tools
Incorporating heatmaps into your analysis offers a more data-driven way to prepare for matches. Whether you’re looking at the entire team or focusing on individual players, heatmaps allow you to visualize key events and identify patterns that may otherwise go unnoticed. By understanding where your next opponent is most active — whether in their attacking actions, defensive duels, or ball recoveries — you can fine-tune your training sessions and tactical approach to gain the upper hand.
More information: https://doi.org/10.1016/j.chaos.2022.112827