


20 Oct From 20th to 1st: FC Barcelona Breaks LaLiga’s Defensive Pattern
Only two teams in LaLiga contest a greater proportion of defensive duels in midfield than in their own third. Barcelona take this behaviour to an extreme.
Football coaches frequently talk about high, medium and low defensive blocks. But where a team positions itself defensively is not necessarily where it actually fights for possession.
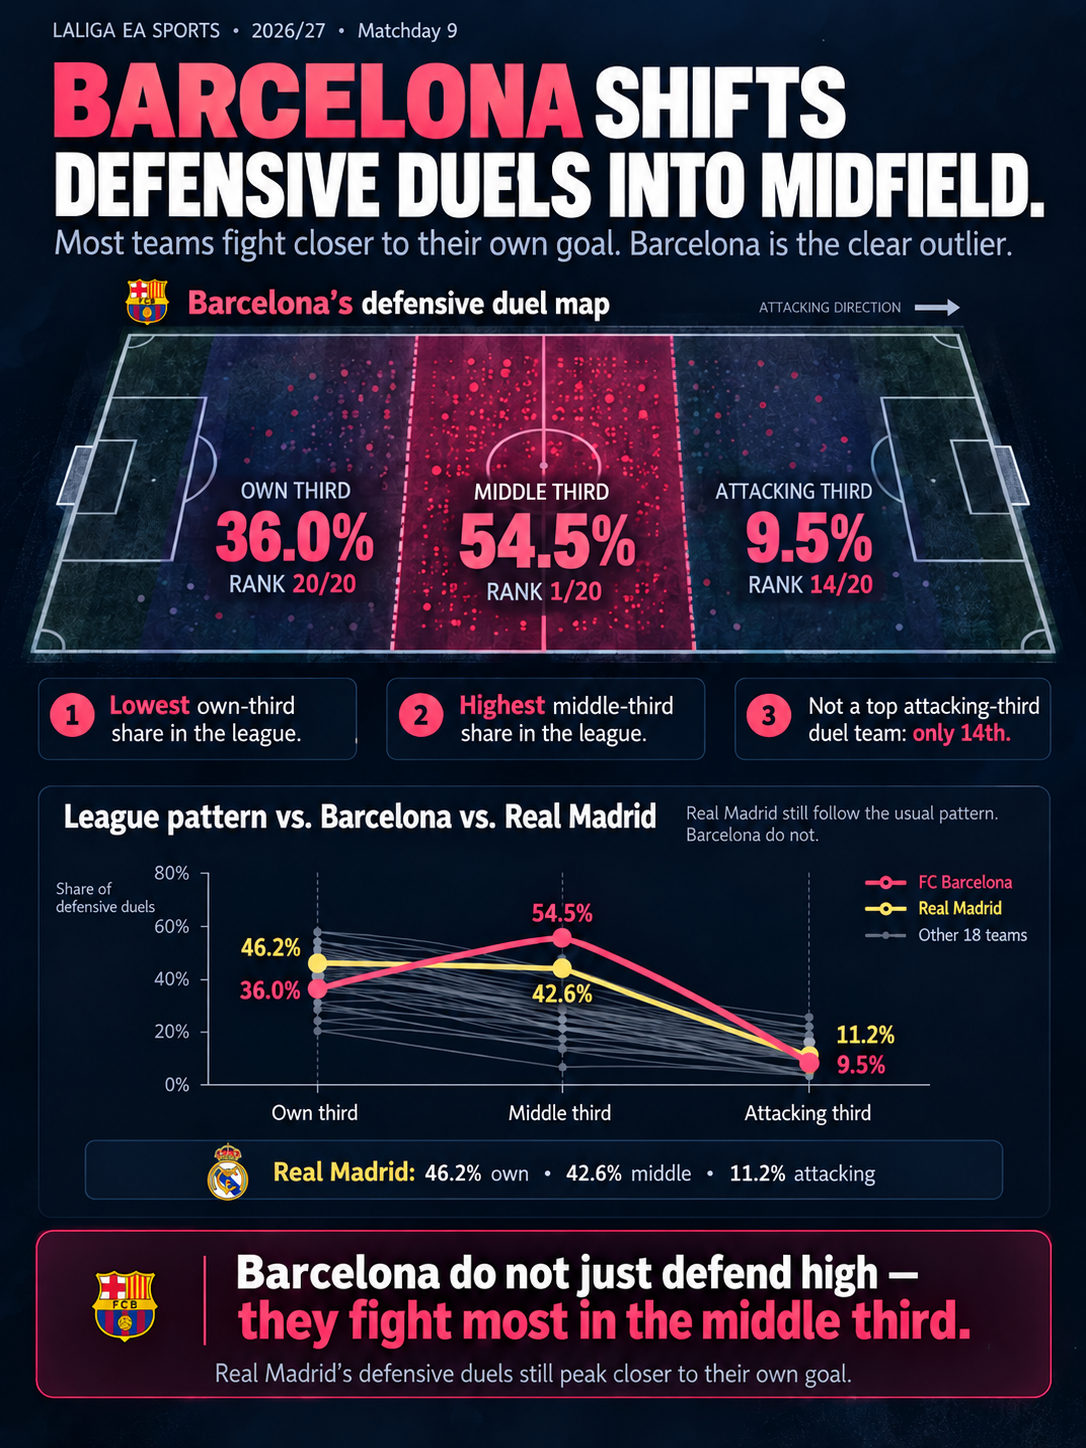
The distribution of defensive duels across LaLiga EA SPORTS 2026/27 reveals a striking pattern.
The rule — and the exception
Across the 20 teams, defensive duels follow a clear territorial distribution:
- 50.5% in the own third.
- 39.3% in the middle third.
- 10.2% in the attacking third.
For 18 teams, the proportion increases progressively as play gets closer to their own goal.
Only FC Barcelona and Athletic Club reverse this pattern.
Barcelona are by far the most extreme case:
- 20th in own-third defensive duel share: 36.0%.
- 1st in middle-third defensive duel share: 54.5%.
- Joint 14th in attacking-third defensive duel share: 9.5%.
Barcelona’s middle-third share exceeds their own-third share by 18.5 percentage points. For Athletic Club, the only other team displaying this reversal, the difference is just 3.1 points.
The exceptional feature of Barcelona’s defensive behaviour is therefore not a particularly high share of duels near the opposition’s goal. It is the concentration of defensive confrontations in midfield.
Barcelona vs Real Madrid: positioning is not confrontation
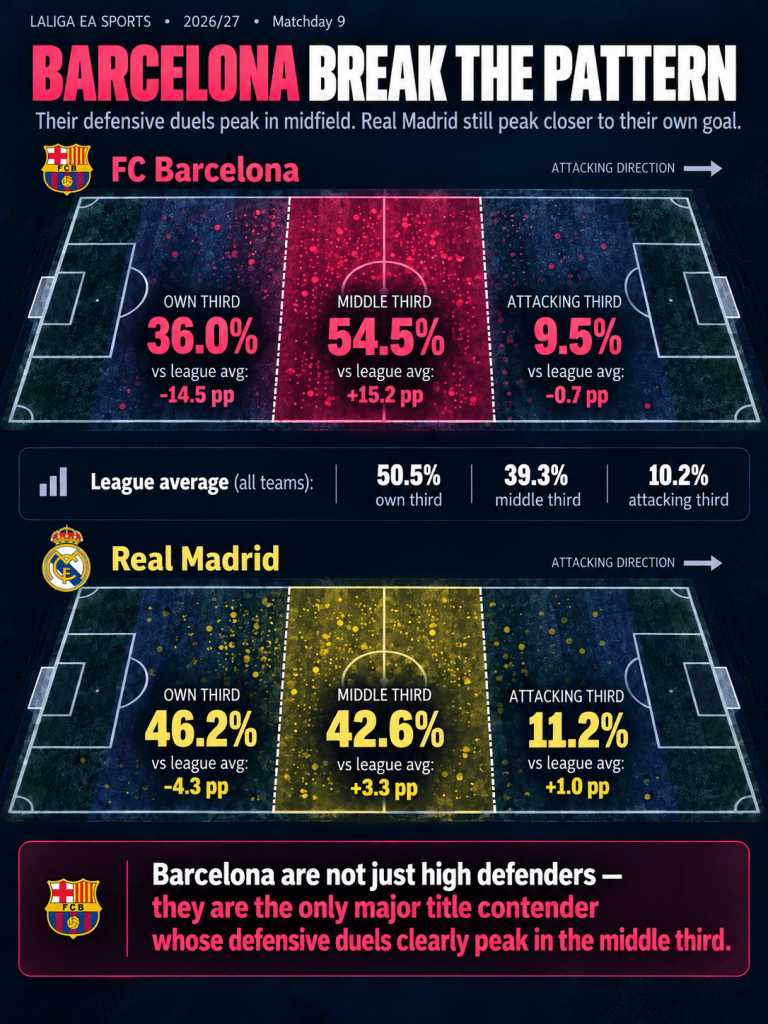
The comparison between the two clubs makes the distinction particularly clear.
Barcelona maintain an average defensive-line height of 38 metres from their own goal, compared with 31 metres for Real Madrid.
Yet Real Madrid contest a slightly higher proportion of their defensive duels in the attacking third (11.2% versus 9.5%).
The most substantial difference appears in midfield: 54.5% for Barcelona versus 42.6% for Real Madrid.
From a coaching perspective, the height of the defensive line matters. When coordinated with pressure on the ball and the offside rule, an advanced line can help restrict the space available for opponents to progress.
However, the relationship is not necessarily causal. Possession, opposition behaviour and match situations also influence where defensive duels occur.
A higher defensive line does not automatically mean more duels in the attacking third. Its territorial impact may be most visible in midfield.
Complete LaLiga ranking: where teams contest defensive duels
Teams are ranked by their percentage of defensive duels in the own third. The final column shows the difference between the middle-third and own-third shares.
| # | Team | Own % | Middle % | Attacking % | Mid − Own (pp) |
|---|---|---|---|---|---|
| 1 | Valencia CF | 58.6 | 31.8 | 9.6 | −26.8 |
| 2 | Real Betis | 56.3 | 37.0 | 6.7 | −19.3 |
| 3 | Elche CF | 54.6 | 32.7 | 12.7 | −21.9 |
| 4 | Racing de Santander | 53.9 | 33.5 | 12.7 | −20.4 |
| 5= | Getafe CF | 53.8 | 36.7 | 9.5 | −17.1 |
| 5= | Rayo Vallecano | 53.8 | 38.1 | 8.1 | −15.7 |
| 7 | Deportivo Alavés | 53.6 | 34.4 | 12.0 | −19.2 |
| 8 | RC Deportivo | 53.5 | 38.8 | 7.7 | −14.7 |
| 9 | RCD Espanyol | 52.5 | 42.3 | 5.3 | −10.2 |
| 10 | Málaga CF | 52.2 | 35.0 | 12.8 | −17.2 |
| 11 | Real Sociedad | 50.8 | 38.4 | 10.8 | −12.4 |
| 12 | RC Celta | 50.7 | 39.3 | 10.0 | −11.4 |
| 13 | CA Osasuna | 49.6 | 39.1 | 11.3 | −10.5 |
| 14 | Atlético de Madrid | 49.4 | 40.8 | 9.8 | −8.6 |
| 15 | Sevilla FC | 49.1 | 40.4 | 10.6 | −8.7 |
| 16 | Levante UD | 47.1 | 43.7 | 9.2 | −3.4 |
| 17 | Villarreal CF | 46.5 | 43.0 | 10.5 | −3.5 |
| 18 | Real Madrid | 46.2 | 42.6 | 11.2 | −3.6 |
| 19 | Athletic Club | 41.7 | 44.8 | 13.5 | +3.1 |
| 20 | FC Barcelona | 36.0 | 54.5 | 9.5 | +18.5 |
| — | LaLiga average | 50.5 | 39.3 | 10.2 | −11.2 |
Positive values in the final column indicate a greater share of defensive duels in midfield than in the team’s own third. Only Barcelona and Athletic Club register positive values.
The opposite extreme is Valencia, with 58.6% of their defensive duels in their own third and just 31.8% in midfield. These figures describe territorial duel distribution, however, not the proportion of time spent defending in a low block.
What does this mean for coaches?
The key is to distinguish defensive positioning from defensive confrontation.
A team’s defensive line tells us where its last defensive unit is positioned. Duel location tells us where players actually engage opponents.
For practical analysis, coaches should consider three questions: Where does the team position itself? Where does it contest possession relative to the opposition’s attacking activity? And what happens after those duels — does the team recover the ball, stop progression or allow the attack to continue?
Barcelona’s figures offer a compelling starting point, but not a complete explanation of their defensive effectiveness.
Understanding a defensive block requires more than knowing where players stand. It also means understanding where — and how successfully — they challenge the opposition.
Data and methodology
LALIGA EA SPORTS 2026/27, through Matchday 9. The analysis includes all 20 teams, with 7–9 matches played depending on the club.
Percentages represent each team’s distribution of defensive duels (aerial and ground) across the three longitudinal thirds of the pitch, aggregated over the available matches. LaLiga averages are unweighted means of the 20 team percentages.
These figures measure the relative location of defensive duels, not duel frequency per minute, time spent defending in each zone, duel success or tactical intention. Match context, possession and opposition behaviour have not been controlled for. Minor differences from 100% may arise from rounding.