


14 Jul How Much Do They Shoot—and How Can You Create Shots Against Them?
A shot-profile matrix for opposition analysis
Preparing for the next opponent usually begins with familiar questions. How do they build? Where do they progress? What happens after they regain possession? How do they defend their box?
But those questions can be reorganised around two outcomes that matter directly to the match plan:
How much does the opponent shoot, and through which phases of play do those shots emerge?
How many shots do they concede, and through which phases do opponents generate them?
Two teams may produce the same number of shots but arrive at them through completely different routes. One may finish mainly after sustained creation, another during transition and another from set pieces.
The same applies defensively. Two teams may concede a similar volume, but one may be exposed immediately after losing the ball while the other allows opponents to establish possession and finish during the creation phase.
To capture both sides of the problem, we classified LALIGA teams twice:
- Offensive clustering: how much they shoot and how they generate those shots.
- Defensive clustering: how many shots they concede and how opponents generate them.
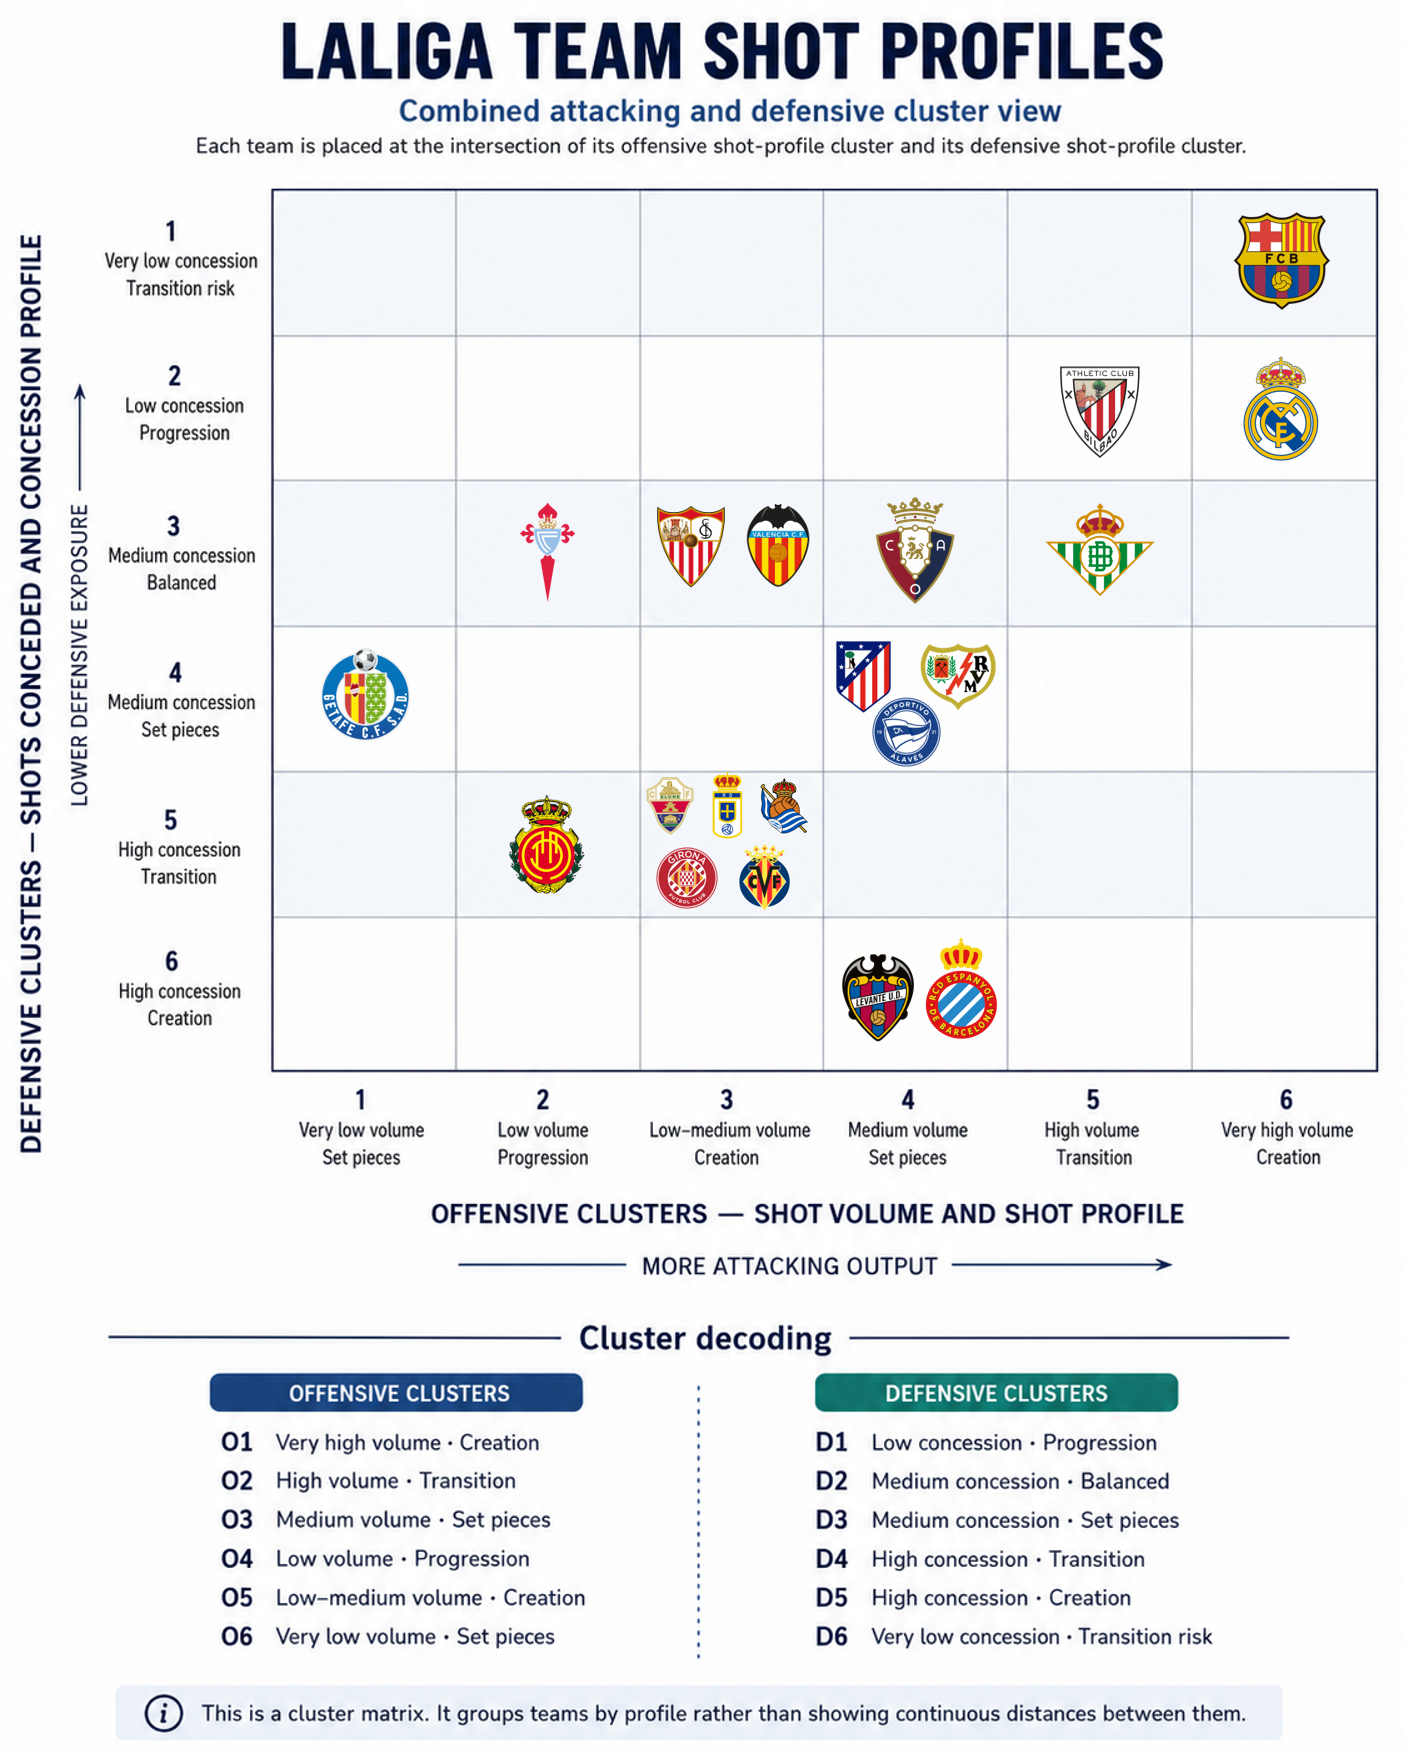
The result is a matrix in which every team occupies one exact intersection between an offensive and a defensive profile.
The matrix is not intended to define a team’s entire playing style. It provides a more specific and operational answer.
Where does the opponent’s shot threat come from, and through which routes might we be able to create shots against them?
How to read the matrix
The horizontal axis represents the offensive classification. It combines:
- shot volume;
- Build Up;
- Progression;
- Creation;
- defensive-to-attacking Transition;
- Set Piece Attack.
The vertical axis represents the defensive classification. It combines:
- shots conceded;
- opponent Build Up;
- opponent Progression;
- opponent Creation;
- opponent defensive-to-attacking Transition;
- opponent Set Piece Attack.
Moving to the right generally indicates greater attacking production. Moving upwards generally indicates lower defensive exposure. However, each row and column also identifies the context in which shots are generated or conceded.
This is why the matrix should not be read as a conventional ranking. Two teams may occupy the same offensive column but different defensive rows. They may pose a similar problem when they have the ball, yet require very different plans when we attack them.
Five tactical insights from the matrix
1. Similar attacking output does not imply the same match plan
FC Barcelona and Real Madrid share the same offensive cluster:
Very high shot volume · Creation
Both repeatedly convert advanced attacking possession into shots. Against either team, defending only the final action is unlikely to be enough. The first challenge is to reduce how often they reach stable creation situations around the final third.
However, they occupy different defensive clusters.
Barcelona concedes very few shots, but transition represents a high proportion of the limited attempts it allows. Real Madrid also concedes relatively little, although opponents reach a larger share of their shots during progression.
The implication is important:
- against Barcelona, the most valuable moments may arise immediately after recovery and before the counterpress closes the attack;
- against Real Madrid, opportunities may also emerge while progressing, before the defensive structure becomes fully organised.
The offensive threat is similar. The route for attacking them is not.
2. Barcelona’s transition profile must be interpreted in absolute and relative terms
Barcelona appears in:
Very low concession · Transition risk
This does not mean that Barcelona concedes a large absolute number of transition shots. It concedes the lowest overall shot volume.
The finding is relative: within that small total, transition accounts for a comparatively large share.
That distinction changes the coaching message. The plan should not be:
“Barcelona gives up many transitions.”
It should be:
“Barcelona gives up very few shots, but the shots it does allow are disproportionately likely to appear immediately after possession changes.”
The opportunity is therefore scarce but identifiable. Recovery orientation, the first forward pass, supporting runs and the ability to escape the counterpress become especially important because there may be few other repeatable routes to the shot.
3. Getafe is not merely at the low end of a continuum
Getafe forms its own offensive cluster:
Very low shot volume · Set-piece dependent
Its position is not simply the consequence of producing fewer shots. It combines:
- the lowest attacking volume;
- a low proportion of shots during Creation;
- an exceptionally high share from set pieces.
Approximately four out of every ten Getafe shots originate from restarts.
That makes the singleton cluster analytically meaningful. The preparation priority is not only conventional set-piece defence. It also includes controlling the conditions that feed that route:
- avoiding unnecessary fouls in delivery areas;
- preventing repeated corners and long restarts;
- defending second contacts;
- reorganising after partial clearances;
- avoiding territorial sequences in which one restart leads to another.
The matrix therefore distinguishes between low-volume attacks that still reach Creation and a low-volume attack whose threat is concentrated in a very different phase.
4. High shot concession can arise from different defensive problems
Two defensive clusters concede a high number of shots:
- High concession · Transition
- High concession · Creation
They should not lead to the same attacking plan.
Against teams exposed in transition, the priority is to identify:
- where they lose possession;
- how many players remain ahead of the ball;
- whether the centre is protected;
- how effectively they counterpress;
- which first action eliminates the greatest number of defenders.
The solution is not simply to “counterattack more”. It is to structure recoveries and first actions so that the temporary imbalance becomes exploitable.
Against teams that concede mainly during Creation, the attack may require greater patience:
- stable occupation of the final third;
- circulation that displaces the defensive block;
- repeated penalty-area entries;
- recovery of clearances;
- continuation of the attack rather than forcing the first available shot.
Both profiles concede heavily. One rewards immediacy; the other rewards sustained attacking control.
5. The matrix reveals combinations that a single clustering would hide
The offensive and defensive identities of a team are not necessarily symmetrical.
Real Betis and Athletic Club share an offensive cluster characterised by high shot volume and a strong transition component. Yet their defensive profiles differ. Athletic concedes relatively few shots, while Betis occupies a medium-concession, more balanced defensive group.
Similarly, several teams share a low–medium-volume Creation profile offensively but differ in how they are attacked. Some concede heavily in transition, while others show a more balanced distribution.
This is the main reason for constructing two separate clusterings.
A global clustering would tend to compensate one side with the other. Offensive similarity could be obscured by defensive difference, or defensive similarity by offensive difference. The matrix preserves both identities and allows the analyst to describe the opposition more precisely:
How they threaten us and where they may be vulnerable are related questions, but they are not the same question.
Offensive shot-generation profiles
The offensive analysis produced six clusters.
| Cluster | Profile | Teams |
|---|---|---|
| O1 | Very high volume · Creation | FC Barcelona, Real Madrid |
| O2 | High volume · Transition | Athletic Club, Real Betis |
| O3 | Medium volume · Set pieces | Atlético de Madrid, CA Osasuna, Deportivo Alavés, Levante UD, Rayo Vallecano, RCD Espanyol |
| O4 | Low volume · Progression | RC Celta, RCD Mallorca |
| O5 | Low–medium volume · Creation | Elche CF, Girona FC, Real Oviedo, Real Sociedad, Sevilla FC, Valencia CF, Villarreal CF |
| O6 | Very low volume · Set-piece dependent | Getafe CF |
These labels describe the combination of production and context, not the complete attacking model.
For example, a high transition share does not prove that a team plays only on the counterattack. It means that, relative to the other teams, a larger proportion of its shots occurs before a fully established attacking structure has developed.
Likewise, a high Creation share does not necessarily imply high possession. It indicates that a large proportion of the team’s shots occurs once the attack has reached the creation phase.
Defensive shot-concession profiles
The defensive analysis also produced six clusters.
| Cluster | Profile | Teams |
|---|---|---|
| D1 | Low concession · Opponent shots in Progression | Athletic Club, Real Madrid |
| D2 | Medium concession · Balanced profile | CA Osasuna, RC Celta, Real Betis, Sevilla FC, Valencia CF |
| D3 | Medium concession · Set-piece exposure | Atlético de Madrid, Deportivo Alavés, Getafe CF, Rayo Vallecano |
| D4 | High concession · Transition vulnerability | Elche CF, Girona FC, RCD Mallorca, Real Oviedo, Real Sociedad, Villarreal CF |
| D5 | High concession · Opponent shots in Creation | Levante UD, RCD Espanyol |
| D6 | Very low concession · Transition risk | FC Barcelona |
A high proportion of shots conceded from set pieces should not automatically be interpreted as poor set-piece defence. It may also reflect the number of restarts conceded, the general match profile or a low volume of open-play shots.
The clusters identify where the shots come from, not whether the team defends each phase efficiently.
From matrix position to opposition analysis
The matrix can be used as the first layer of an opponent report.
For any team, the analyst can begin with four questions:
- How many shots do they generate?
- During which phases do those shots emerge?
- How many shots do they concede?
- During which phases do opponents generate them?
The next step is to connect those findings to video.
For example, if the opponent belongs to a transition-heavy offensive cluster, the video review should focus on:
- the locations of its recoveries;
- the first player activated;
- the direction of the first pass;
- the number and type of supporting runs;
- the rival structures that most frequently produce those transitions.
If it belongs to a defensive cluster exposed during Creation, the analyst should identify:
- how opponents establish possession in the final third;
- which zones cause the defensive block to move;
- whether cut-backs, crosses or central combinations produce the shots;
- how effectively the defence clears and reorganises;
- whether the same attack can be sustained after the first intervention.
The matrix therefore does not replace video analysis. It prioritises it.
Instead of reviewing every phase with the same level of attention, the coaching staff can begin with the situations most closely associated with the opponent’s shot production and concession.
Methodology
The analysis used match-level data from the complete LALIGA season. Each observation represented one team in one match and included:
- total shots;
- total shots conceded;
- percentage of shots generated in each phase;
- percentage of shots conceded in each opposition phase.
Why match percentages were not simply averaged
Percentages based on a small number of shots are unstable.
With four attempts, one shot represents 25 percentage points. With twenty attempts, it represents only five. Giving those two matches equal weight would distort the seasonal profile.
The number of shots in each phase was therefore reconstructed:Shotsphase,match=Shotstotal,match×100%Shotsphase,match
The seasonal phase distribution was then calculated as:%Shotsphase,season=∑Shotstotal,match∑Shotsphase,match×100
This allows all matches to remain in the analysis while giving greater weight to matches containing more shot information.
Variables
The offensive clustering combined:
- shots per match;
- Build Up;
- Progression;
- Creation;
- defensive-to-attacking Transition;
- Set Piece Attack.
The defensive clustering combined:
- shots conceded per match;
- opponent Build Up;
- opponent Progression;
- opponent Creation;
- opponent defensive-to-attacking Transition;
- opponent Set Piece Attack.
Counterattack was not included independently because it appears to be nested within the broader transition category. Including both without adjustment would give excessive weight to the same underlying behaviour.
Clustering and selection of groups
Shot-phase percentages are compositional: an increase in one phase necessarily changes the relative share of the others. The phase distribution was therefore treated as a composition rather than as a set of completely independent metrics.
Shot volume and phase distribution were standardised and balanced so that:
- volume remained relevant;
- it did not overwhelm the phase profile;
- the phase block did not dominate merely because it contained more variables.
Solutions containing four, five and six clusters were compared using:
- Silhouette coefficient;
- Davies–Bouldin index;
- group size;
- tactical interpretability.
Six clusters were retained for both analyses. Smaller solutions occasionally produced slightly stronger global separation, but grouped together teams with football profiles that were too different to produce a useful interpretation.
Singleton clusters were retained when the underlying profile was genuinely distinctive, as occurred with Getafe offensively and Barcelona defensively.
Limitations
The matrix describes shot production and concession. It does not describe the complete playing model.
It does not directly include:
- possession;
- passing volume;
- attack duration;
- progression speed;
- field position;
- shot location or quality;
- expected goals;
- scoreline;
- opposition strength;
- formation.
For that reason, the labels should remain descriptive.
The model does not prove that a team is direct, positional, efficient or inefficient. It identifies:
how frequently it shoots, the phases in which those shots emerge, how frequently it concedes shots and the phases through which opponents generate them.
That is a narrower conclusion than defining playing style, but it is also easier to translate into opposition preparation.
A starting point for the next match
Opposition analysis often produces more information than a coaching staff can realistically use.
The challenge is not only to collect data, but to organise it around decisions.
This matrix condenses the opponent into two complementary profiles:
How they create their shots.
How opponents create shots against them.
It does not provide the match plan automatically. It identifies the situations that deserve priority, the questions that should guide the video review and the phases in which tactical solutions are most likely to matter.
In that sense, its main value is not classification.
It is knowing where to look first.
Note: This analysis covers the complete 2025/26 LALIGA EA SPORTS season.