


28 Sep The shorter the shift, the higher the intensity
A substitute does not simply play fewer minutes. The same player appears to play those minutes at a different intensity.
Using tracking data from the complete 2025/26 LALIGA EA SPORTS season, we analysed 225 players who had at least five valid appearances both as starters and substitutes, with a minimum of 10 minutes played in each appearance.
The key difference from a traditional starters-versus-substitutes comparison is simple: each player was compared with himself.
And the pattern was clear.
Same player, different intensity
When the same footballer came from the bench, his physical output per minute increased across every metric analysed.
High-speed running above 21 km/h increased by 18–22%, while running above 24 km/h increased by 21–24%. Total distance per minute increased much less: approximately 3–6%.
| Metric | Starter | Substitute | Change |
|---|---|---|---|
| >21 km/h — attacking phase | 13.02 | 15.85 m/min | +21.8% |
| >21 km/h — defensive phase | 14.61 | 17.28 m/min | +18.3% |
| >24 km/h — attacking phase | 6.28 | 7.80 m/min | +24.2% |
| >24 km/h — defensive phase | 6.13 | 7.46 m/min | +21.5% |
| Distance/min — attacking phase | 145.23 | 153.42 | +5.6% |
| Distance/min — defensive phase | 155.53 | 160.86 | +3.4% |
This was not an effect produced by a handful of unusual players. For example, 92% of players increased their attacking distance per minute when used as substitutes. The overall direction was also remarkably consistent across positions and clubs.
But starter versus substitute may not be the most interesting comparison.
The shorter the exposure, the higher the intensity
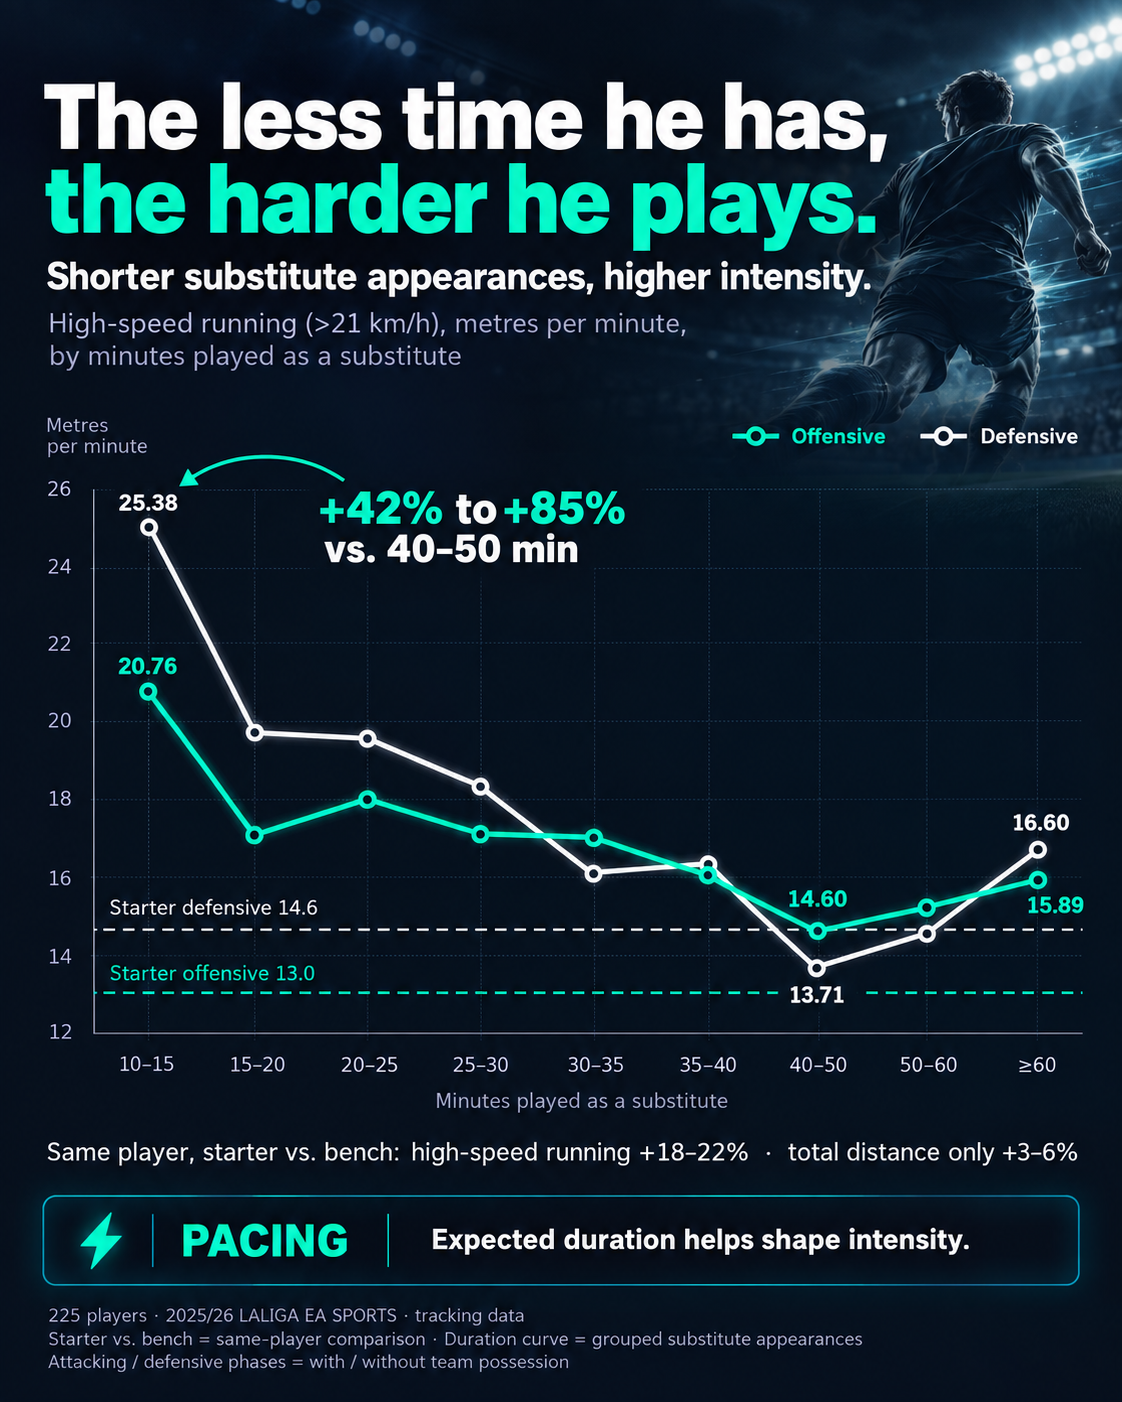
Among substitute appearances, physical intensity was strongly related to how long the player remained on the pitch.
Players used for only 10–15 minutes produced substantially more high-speed running per minute than players used for approximately 40–50 minutes.
For running above 21 km/h, the difference was approximately:
- +42% in the attacking phase
- +85% in the defensive phase
For running above 24 km/h:
- +58% attacking
- +82% defensive
Total distance changed much less.
That distinction matters. Shorter appearances are associated not simply with more movement, but particularly with a much greater density of high-intensity movement.
The relationship is not perfectly linear when appearances are divided into arbitrary time bands. However, when minutes played are analysed continuously while controlling for the individual player, the same pattern remains: as playing exposure increases, intensity per minute decreases.
[FIGURE: High-speed running per minute according to minutes played as a substitute]
A possible pacing effect
This pattern is consistent with the concept of pacing.
Pacing describes how athletes regulate effort according to the amount of work they expect to sustain. The intensity that can be maintained for 10 minutes is obviously different from that which must be maintained for 90.
Football is more complex than a continuous endurance task, but the principle may still apply.
A substitute entering late in the match is fresher, but he also faces a much shorter competitive horizon. Our results suggest that the physical intensity expressed by a player may therefore depend not only on his physical capacity, but also on how long that intensity needs to be sustained.
Importantly, these data do not prove that anticipatory pacing causes the effect. Late substitutes enter different tactical and scoreline contexts, face opponents with accumulated fatigue and may encounter different amounts of space. All of these factors can contribute.
The appropriate interpretation is therefore that the observed pattern is consistent with pacing, not that pacing has been demonstrated as its sole mechanism.
Why this matters
For coaches and performance staff, three practical consequences stand out.
First, substitute and starter benchmarks are not directly interchangeable. A player’s exceptionally high m/min during a short appearance does not necessarily represent a change in physical capacity.
Second, minutes and intensity should be interpreted together. Twenty match minutes are not simply one quarter of an 80-minute exposure. Short appearances can contain a disproportionately high density of high-speed actions.
Third, short return-to-play appearances require caution. Producing excellent intensity over 10–15 minutes does not demonstrate that the same output can be sustained for 60 or 90 minutes.
There may be no single “match intensity”
Physical performance is often described as though every player possessed a characteristic match intensity.
Our data suggest a different interpretation.
The same footballer can operate at substantially different intensities depending on the duration of his competitive exposure.
A player may therefore not have one match intensity, but a range of intensities shaped partly by the time he has to sustain them.
And that makes one of football’s simplest variables — minutes played — considerably more informative than it first appears.
Methodological note
The analysis included players with ≥5 appearances as starters and ≥5 as substitutes, considering only appearances of ≥10 minutes. Player-role averages were weighted by minutes played. Attacking and defensive phases refer to periods with and without team possession, respectively. The duration-intensity relationship among substitutes was additionally assessed continuously while accounting for repeated observations within players.