


25 Sep Running More Does Not Mean the Same Thing for Every Team
Five LALIGA EA SPORTS seasons show why running data should be interpreted match by match, team by team and metric by metric
Football loves simple explanations.
A team loses and one conclusion quickly appears:
“They need to run more.”
It is intuitive. Total distance is easy to understand, easy to compare and easy to rank.
And there is some truth behind the intuition: across five complete LALIGA EA SPORTS seasons, the team covering more total distance won 61.6% of matches with a winner.
But that also means something else:
In almost 4 out of every 10 matches, the team that ran less won.
And the league-wide average hides an even more interesting story.
Running more does not mean the same thing for every team.
The average hides the story
Running data are often discussed through accumulated season averages:
Who covers the most distance? Who runs the least? Where does each team rank?
Those questions are descriptive and perfectly valid.
But they are not exactly the same as asking:
Is a team more likely to win when it outruns its opponent?
For that question, the match provides a more meaningful comparison.
Because:
Points are not won against a distance ranking. They are won against an opponent.
So, rather than comparing a season-long physical ranking with the league table, we analysed each match individually.
For every team, we calculated:
- how often it covered more distance than its opponent when it won;
- how often it did so when it lost.
We repeated the analysis for two physical dimensions:
Total distance, as the most intuitive expression of “running more”, and distance covered above 25.2 km/h, as a simple representation of high-intensity sprint distance.
The objective was not to establish causality.
It was to answer a simpler question:
Does outrunning the opponent distinguish wins from defeats in the same way for every team?
It does not.
Measuring sensitivity to outrunning the opponent
A useful way of expressing that relationship is to calculate what we can call the Outrunning Sensitivity Gap:
% of wins outrunning the opponent − % of defeats outrunning the opponent
A large positive value means that outrunning the opponent is much more characteristic of wins than defeats.
A value close to zero means that running more occurs similarly under both results.
And a negative value means that the team actually outruns its opponent more frequently when losing than when winning.
This is useful because it preserves the magnitude of the relationship instead of reducing it immediately to a category.
For visual communication, the analysis can still be grouped descriptively into:
🟢 Clear
🟡 Weak
🔴 None
But those labels should be understood as a communication aid rather than a statistical test.
And sample size matters.
A percentage calculated from one defeat should obviously not be interpreted with the same confidence as one calculated from twenty.
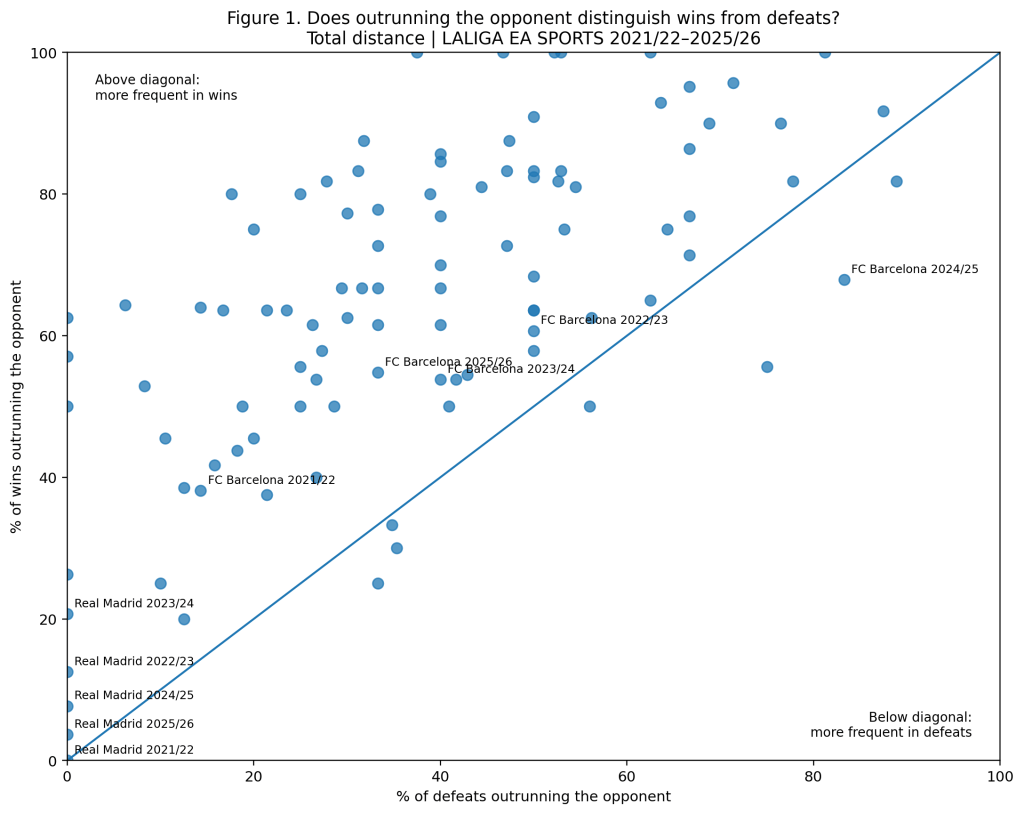
The figure shows every team-season observation according to two dimensions:
- the percentage of wins in which the team covered more distance than its opponent;
- the percentage of defeats in which it did the same.
The diagonal is especially important.
Teams well above it outran their opponents much more frequently when winning than when losing.
Teams close to it show little differentiation.
And teams below it actually outran their opponents more frequently in defeats.
The relevant question is therefore not simply:
“How often does this team run more when it wins?”
but:
“How different is that behaviour between wins and defeats?”
Once teams are viewed this way, the league stops looking homogeneous.
Real Madrid: volume and intensity tell different stories
Real Madrid provides an unusually clear example.
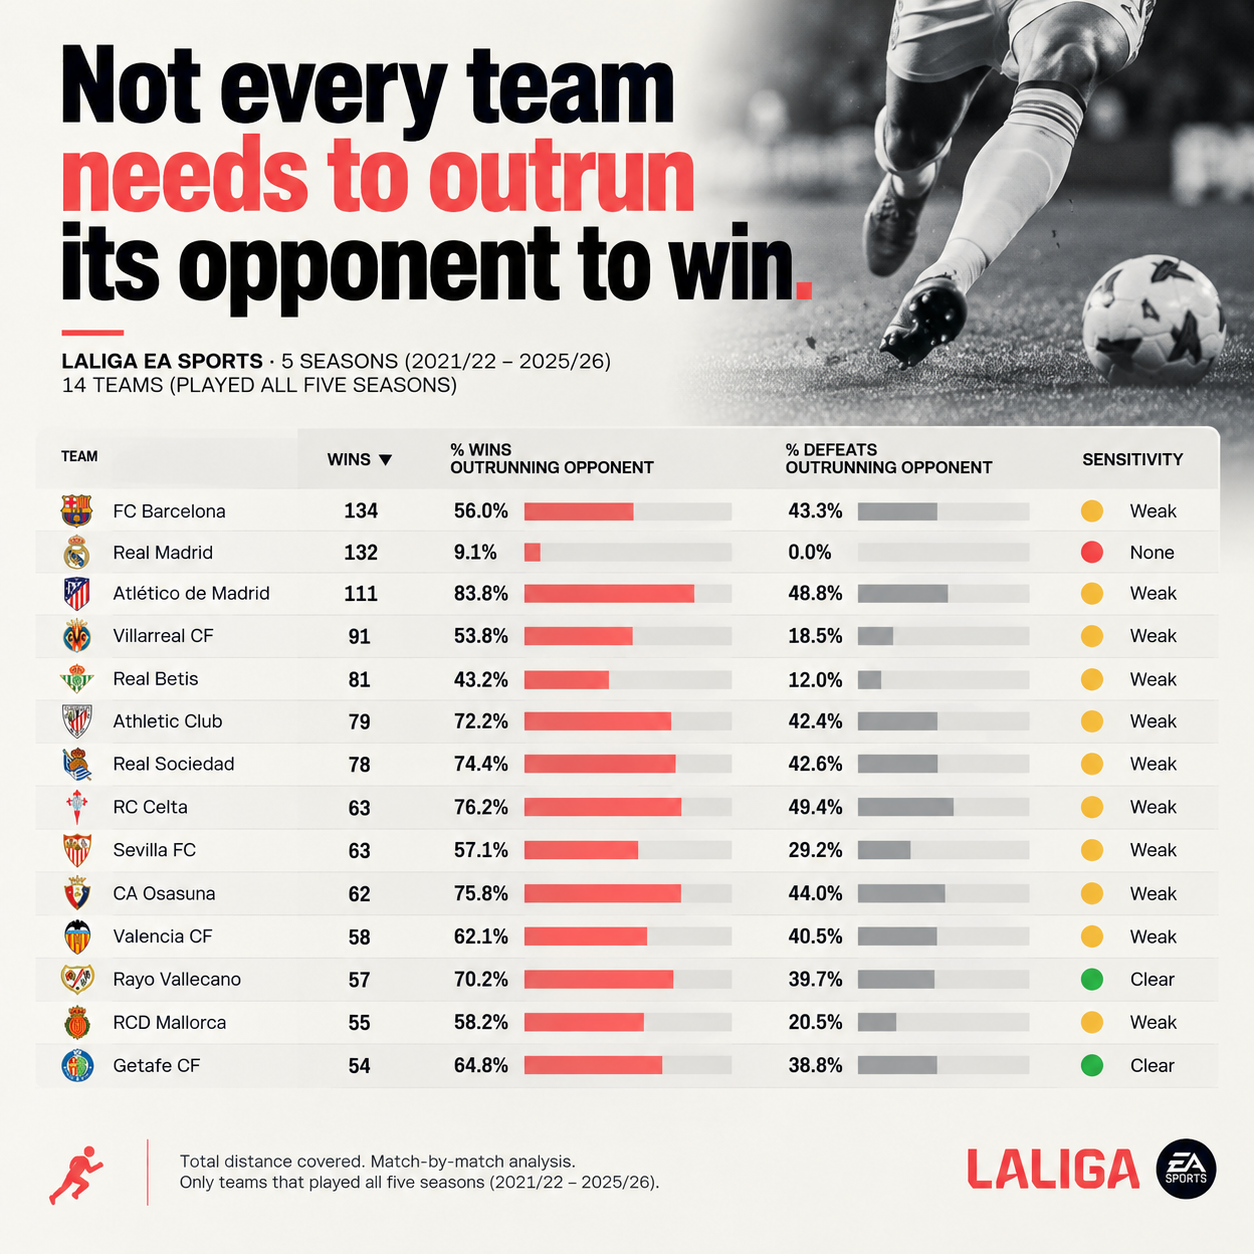
Across the five-season total-distance analysis, the club recorded 132 wins.
It covered more total distance than its opponent in only 9.1% of them.
Across its 25 defeats, it did so in 0%.
This does not mean that physical performance is irrelevant to Real Madrid.
It means something much more specific:
Outrunning the opponent in total distance barely distinguishes Real Madrid wins from Real Madrid defeats.
But change the physical metric and the picture becomes very different.
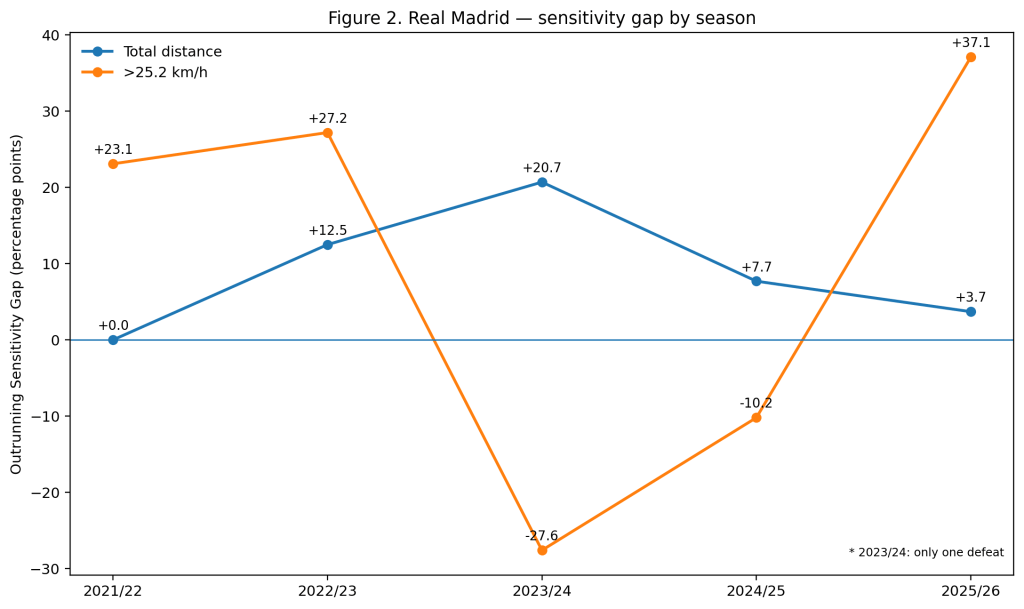
The longitudinal profile is striking.
In 2021/22, Real Madrid won the league while covering more total distance than its opponent in 0% of its 26 wins.
Yet in that same season it exceeded the opponent above 25.2 km/h in 73.1% of wins.
The contrast appears again in 2025/26:
- more total distance in only 3.7% of wins;
- more distance above 25.2 km/h in 70.4% of wins;
- compared with 33.3% of defeats at >25.2 km/h.
That produces a +37.1 percentage-point sensitivity gap for high-intensity distance.
Same team.
Same season.
Different physical dimension.
Different story.
Volume and intensity are not interchangeable.
There is also a useful reminder in 2023/24. Real Madrid suffered only one league defeat, so any percentage based on defeats that season is extremely sensitive to that single match.
Context and sample size still matter.
A club does not have one immutable running profile
The longitudinal perspective adds another layer.
Even within the same club, the relationship can change substantially from one season to another.
FC Barcelona provides a good example.

The 2024/25 season is particularly revealing.
Barcelona covered more total distance than its opponent in 67.9% of wins.
But it also did so in 83.3% of defeats.
Its total-distance sensitivity gap was therefore −15.4 percentage points.
In other words, although Barcelona frequently outran its opponents, that behaviour did not distinguish winning from losing. In fact, it appeared even more frequently in defeats.
One season later, the total-distance gap was positive again.
The high-intensity profile also moves substantially over time: from a +1.2 pp gap in 2024/25 to +38.1 pp in 2025/26.
This suggests an important principle:
A club does not have one fixed physical profile.
Coaches change.
Players change.
Pressing structures change.
Possession patterns change.
Match management changes.
The current analysis cannot identify which of those factors causes a seasonal shift.
But the variability itself shows why describing a club simply as a team that “runs a lot” or “runs little” can be misleading.
Five seasons reveal a moving landscape
Real Madrid and Barcelona are useful examples, but the phenomenon is not restricted to the biggest clubs.
Across the competition, the relationship between outrunning the opponent and winning changes:
- from team to team;
- from season to season;
- and according to the physical metric used.
Rather than thinking only in terms of:
Team
the physical interpretation may need to move closer to:
Team × season × metric × match context
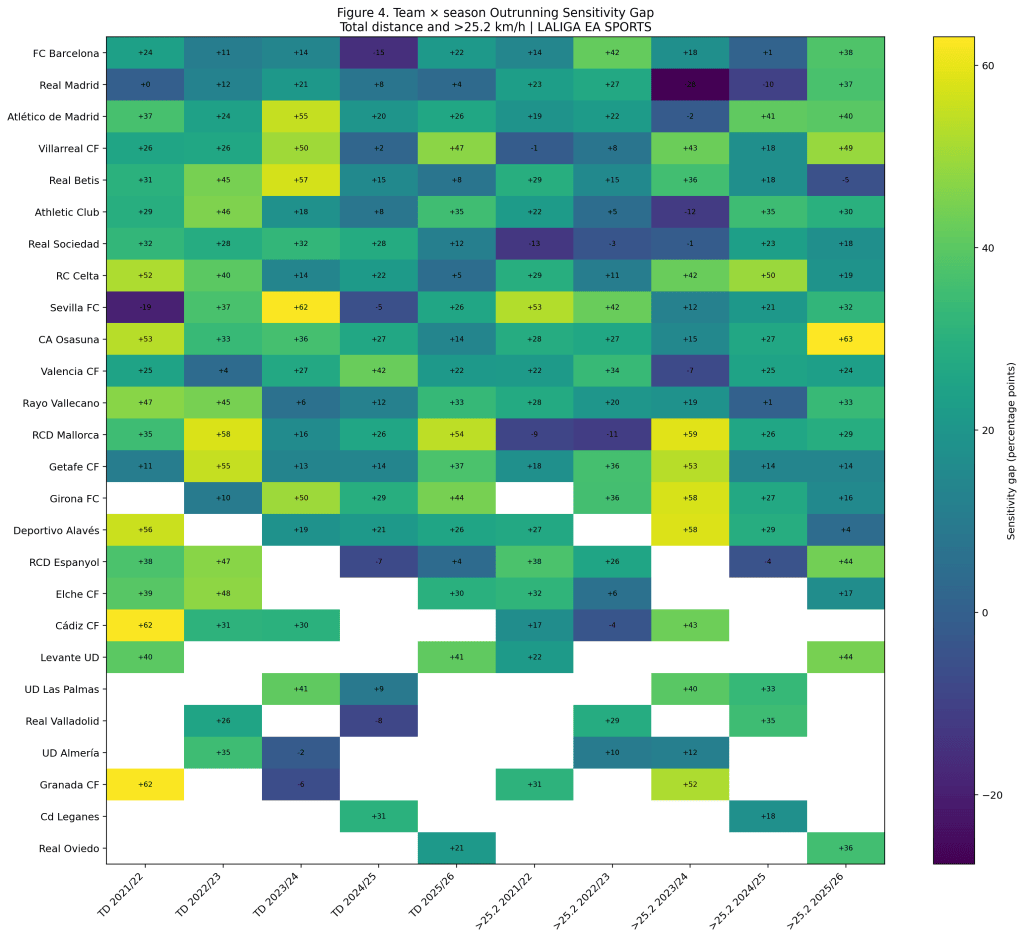
The heatmap makes the heterogeneity immediately visible.
Each cell represents the difference, in percentage points, between:
% wins outrunning the opponent − % defeats outrunning the opponent
Positive values indicate that outrunning the opponent occurred more frequently in wins.
Values around zero indicate little differentiation.
Negative values indicate that it occurred more frequently in defeats.
Blank cells correspond to seasons in which that club did not compete in LALIGA EA SPORTS.
The most important feature of the figure is not any single cell.
It is the absence of a stable universal pattern.
Some teams display large positive gaps in one season and much smaller ones in another.
Others change markedly when total distance is replaced by high-intensity distance.
And some appear relatively insensitive to outrunning the opponent across multiple seasons.
High intensity does not create a universal rule either
It might seem reasonable to expect high-intensity running to have a much stronger relationship with winning than total volume.
At league level, however, the difference was surprisingly small.
Across the five seasons:
- the team covering more total distance won 61.6% of matches with a winner;
- the team covering more distance above 25.2 km/h won approximately 61.9%.
So moving from volume to intensity does not suddenly create a universal physical formula for winning.
What changes is the team-level interpretation.
For some clubs, high-intensity running discriminates wins from defeats much better than total distance.
For others, it does not.
Again:
The average hides the story.
What might be driving these differences?
This analysis describes associations.
It does not establish their mechanisms.
Several contextual factors could plausibly contribute.
Match state. Teams chasing the score may accumulate running because they are losing, while teams already controlling the match may adopt a very different physical behaviour.
Possession. In- and out-of-possession phases generate different locomotor demands.
Playing model. High pressing, low blocks, positional attacks and transition-heavy football create very different movement structures.
Coach and squad. Tactical intentions and player characteristics change across seasons.
Opponent. Football running demands are relational. One team contributes directly to creating the spaces and physical demands experienced by the other.
These should be treated as hypotheses for further analysis, not explanations demonstrated by the present data.
They also point towards an obvious next step: modelling how match state, possession, team level, coach, opponent and physical output interact with match outcome.
Does team quality matter?
The season-by-season results raise another interesting question.
Several teams repeatedly show large positive sensitivity gaps, whereas some of the highest-performing teams often show much weaker relationships with total distance.
It is tempting to interpret this as evidence that lower-quality teams need to compensate by running more.
But the current analysis does not demonstrate that.
A better research question would be:
Does team quality moderate the relationship between outrunning the opponent and winning?
That hypothesis deserves to be tested explicitly rather than inferred visually from the tables.
Interesting patterns should generate hypotheses.
Not shortcuts.
What does this mean for practitioners?
1. Benchmark against the opponent, not only against league averages
A seasonal ranking tells you how much a team runs.
It does not tell you what outrunning the opponent means for that particular team.
2. Separate volume from intensity
Total distance and distance above 25.2 km/h can describe completely different competitive profiles.
A team can systematically cover fewer kilometres while still exceeding its opponent in high-intensity running.
3. Build team-specific baselines
Before interpreting “running more” as positive or negative, understand what that variable historically looks like:
- for that team;
- under that coach;
- within that playing model;
- and against that type of opponent.
4. Be careful with small samples
Six defeats are not twenty defeats.
One defeat is certainly not twenty.
Percentages are useful, but their stability depends on the denominator.
5. Avoid turning association into prescription
A positive relationship does not mean coaches should simply instruct players to run more.
And an absent relationship does not mean physical output is unimportant.
The physical data are part of the match.
They are not independent of it.
The question should change
The lesson from five seasons is not that running less is better.
And it is certainly not that physical performance does not matter.
It is that raw distance has no universal competitive meaning.
Football does not reward kilometres.
It rewards actions.
And the physical demands required to produce those actions differ from one team, one season and one match to another.
So perhaps the next time a team loses, the question should not simply be:
“Did they run enough?”
but:
“What did running more actually mean in this match?”
Because: