


26 Ago Is the Same Goalscorer Really the Same at Home and Away?
A within-player analysis of the complete 2025/26 LALIGA EA SPORTS season shows substantially higher scoring rates at home — driven mainly by greater opportunity generation rather than better finishing.
Home advantage is one of football’s most persistent phenomena. Teams tend to win more, score more and perform differently in their own stadium.
But that aggregate perspective leaves a more specific question unanswered:
Does the same goalscorer behave differently at home and away?
Instead of comparing home teams with away teams, or one group of forwards with another, we compared each player with himself.
Muriqi at home versus Muriqi away.
Mbappé at home versus Mbappé away.
And the same comparison for every goalscorer included in the analysis.
The result was substantial.
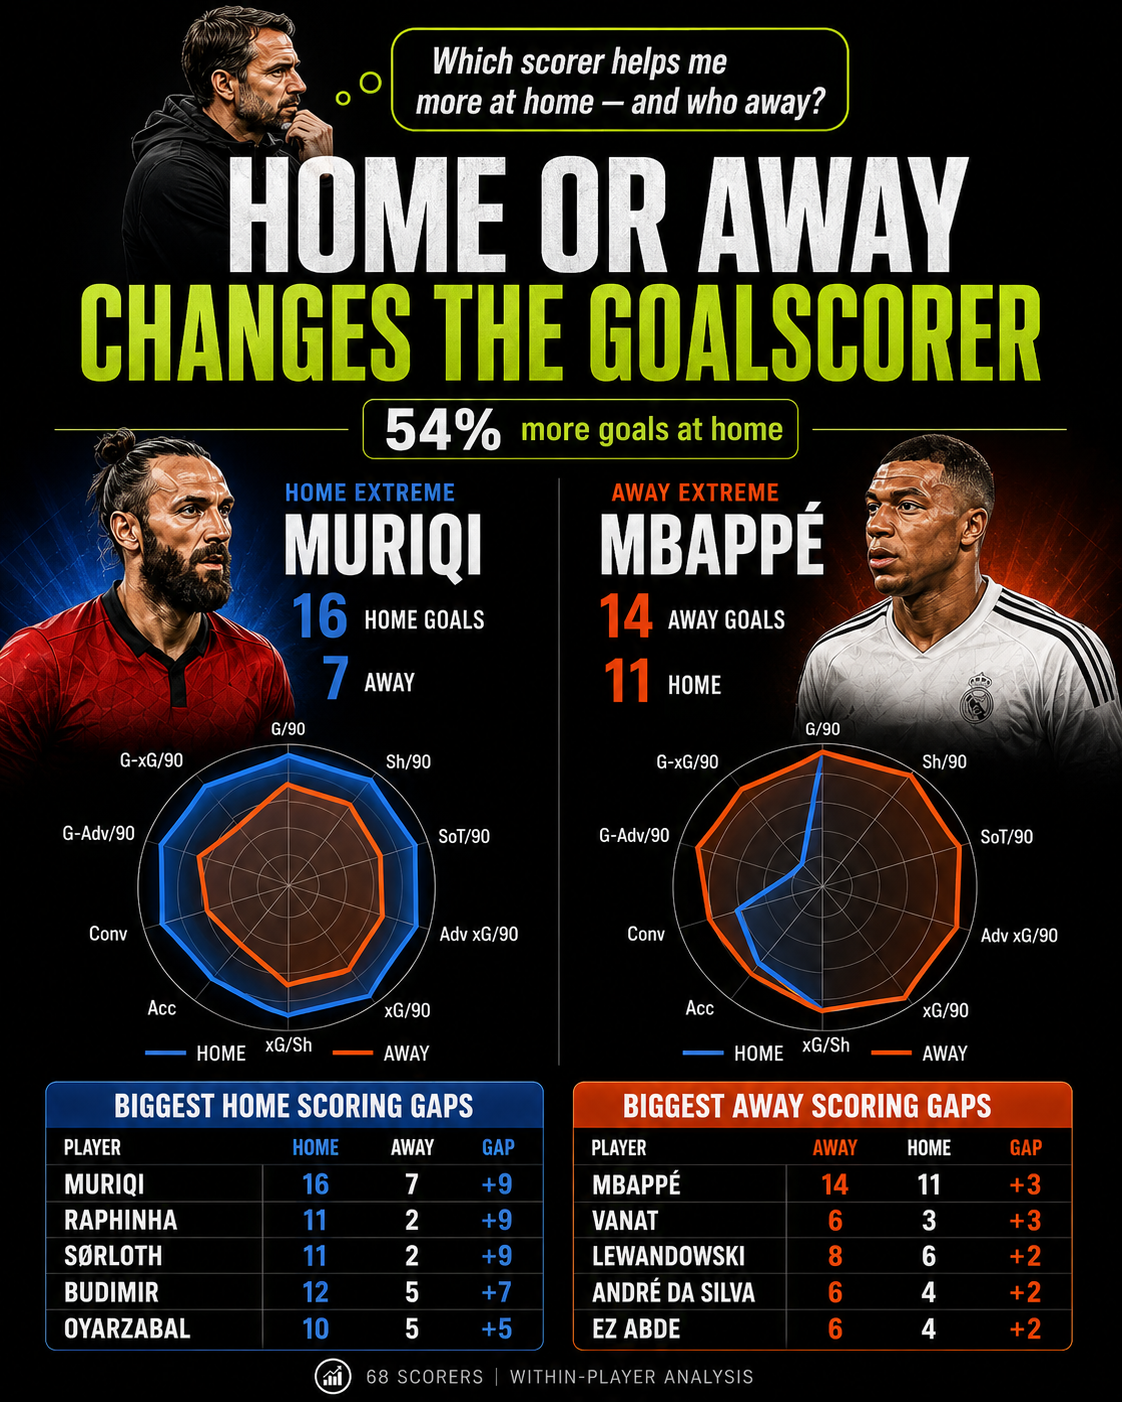
The same goalscorer scored 54% more at home
The analysis included 68 LALIGA EA SPORTS goalscorers from the complete 2025/26 season, after applying minimum thresholds for scoring contribution and playing time in both conditions.
Their collective scoring rate increased from:
0.291 goals per 90 minutes away
to
0.447 goals per 90 minutes at home
When player identity and playing time were accounted for, this corresponds to a 54% higher scoring rate at home.
The pattern was not restricted to a small number of extreme cases. 50 of the 68 players recorded a higher goals-per-90 rate at home than away.
The important question, however, is not simply whether they scored more.
It is why.
More goals — but not necessarily better finishing
If a striker scores more frequently at home, several mechanisms could explain it.
He might receive better chances.
He might shoot more often.
He might hit the target more frequently.
Or perhaps exactly the same opportunities simply produce more goals because finishing improves.
The data allow these possibilities to be separated.
| Offensive metric | Home | Away |
|---|---|---|
| Goals / 90 | 0.447 | 0.291 |
| Shots / 90 | 2.656 | 2.039 |
| Shots on target / 90 | 1.136 | 0.827 |
| Advanced xG / 90 | 0.388 | 0.263 |
| xG / 90 | 0.390 | 0.278 |
All five differences were statistically significant after correction for multiple comparisons.
The sequence is therefore remarkably coherent:
more shots → more shots on target → more xG → more goals
That might suggest that home players simply become more efficient finishers.
But that is not what the remaining metrics show.
Shot quality, shooting accuracy and conversion were numerically different, but those differences were not statistically robust after correcting for multiple testing:
| Finishing-related metric | Home | Away |
|---|---|---|
| xG per shot | 0.148 | 0.139 |
| Shot accuracy | 44.0% | 41.3% |
| Goal conversion | 18.5% | 15.1% |
The same occurred when actual goals were compared with expected goals. Goals minus xG showed a potentially interesting tendency, but it did not remain statistically significant after correction.
This changes the interpretation substantially.
The home advantage seems to create more opportunities, rather than systematically creating better finishers.
Players do not appear to become fundamentally more clinical when they enter their home stadium.
They simply reach shooting situations more often.
What might this mean on the pitch?
That distinction matters.
Suppose a striker scores considerably more at home. Looking only at the goal total could lead to one interpretation:
He finishes better at home.
But the underlying data suggest a different question may be more useful for coaches and analysts:
What changes around the player that allows him to shoot more often?
The answer cannot be established from this analysis alone, but several football mechanisms could plausibly contribute.
A home team may spend more time attacking close to the opposition goal. It may generate more final-third possessions, sustain longer attacking phases or recover the ball higher up the pitch. Match state could also differ: teams may behave differently tactically at home, opponents may defend at different heights, and the attacking player may consequently receive more situations from which a shot can be generated.
These are hypotheses, not conclusions from the current dataset.
But the statistical pattern tells us where the next question should be directed.
If finishing does not change clearly, while shooting volume and accumulated xG do, the most promising explanation is likely to be found before the shot takes place.
The average, however, hides very different players
Population-level results are useful, but football is played by individuals.
The general tendency strongly favours home scoring, yet not every player follows that tendency to the same extent.
Looking at the greatest absolute goal differences among players who scored at least twice in both conditions reveals some striking contrasts.
Biggest home scoring gaps
| Player | Home goals | Away goals | Difference |
|---|---|---|---|
| Muriqi | 16 | 7 | +9 |
| Raphinha | 11 | 2 | +9 |
| Sørloth | 11 | 2 | +9 |
| Budimir | 12 | 5 | +7 |
| Oyarzabal | 10 | 5 | +5 |
Biggest away scoring gaps
| Player | Away goals | Home goals | Difference |
|---|---|---|---|
| Mbappé | 14 | 11 | +3 |
| Vanat | 6 | 3 | +3 |
| Lewandowski | 8 | 6 | +2 |
| André da Silva | 6 | 4 | +2 |
| Ez Abde | 6 | 4 | +2 |
Two players provide particularly intuitive examples.
Muriqi: the home extreme
Muriqi scored 16 goals at home and 7 away.
His profile also shows considerably higher home production in several underlying offensive metrics. His home advantage therefore does not consist simply of the final number of goals: the entire pathway towards scoring opportunities shifts.
Mbappé: the opposite extreme
Mbappé finished the season with 14 away goals and 11 at home.
This does not contradict the league-wide result.
It illustrates something more important: a population tendency does not dictate the behaviour of every individual belonging to that population.
The average goalscorer scores substantially more at home.
A specific goalscorer may not.
Population effects are not individual traits
This distinction is essential if the results are to be used correctly.
The ranking identifies the largest contrasts observed during one complete season. It does not demonstrate that Muriqi possesses a permanent intrinsic “home scorer” characteristic or that Mbappé is inherently more dangerous away.
Individual goal counts remain relatively small compared with the sample available for analysing the population as a whole.
Indeed, when individual player differences were statistically tested, some players showed uncorrected signals, but none remained statistically significant after correction for the large number of individual comparisons.
The conclusions therefore operate at two different levels:
Population level: there is strong evidence that goalscorers produce more goals and more shooting opportunities at home.
Individual level: large home–away contrasts can be observed, but they should be interpreted descriptively rather than as stable player characteristics.
For performance analysis, that difference is fundamental.
How was the comparison made?
A straightforward comparison of total home and away goals would be insufficient.
Players do not play exactly the same number of minutes in both situations, and some players contribute far more goals than others.
The analysis therefore followed several steps.
1. Each player was compared with himself
This is the central methodological decision.
Rather than asking whether one group of home players performs better than another group of away players, each goalscorer’s home performance was compared with his own away performance.
This substantially reduces the influence of stable differences between players such as individual quality, position or general scoring ability.
2. Playing time was taken into account
Raw goals can be misleading when exposure differs.
A player scoring eight goals in 800 minutes has not produced goals at the same rate as someone scoring eight in 1,600.
For this reason, the main outcomes were evaluated relative to minutes played, typically expressed per 90 minutes.
3. Only players with sufficient exposure were included
The principal analysis required:
at least 5 total goals, and
at least 400 minutes played at home and 400 away.
This produced the final sample of 68 paired players.
The objective was to reduce instability produced by players with very little playing time or very few scoring events.
4. Different statistical approaches were used according to the variable
Goals and shot counts are count data. They were analysed using models appropriate for event frequencies while incorporating minutes played as exposure.
Continuous variables were analysed using paired comparisons, because every home observation was linked to the corresponding away observation from the same player.
Bootstrap confidence intervals were also calculated, and a Holm correction was applied when several variables were tested simultaneously.
That final step is important.
If enough statistical tests are performed, some apparently significant results will eventually appear simply by chance. Correcting for multiple comparisons makes the criterion more demanding and reduces that risk.
Does the result depend on where the thresholds were placed?
Any analysis requiring minimum goals or minutes faces an obvious methodological question:
Would the conclusion change if different thresholds were chosen?
We tested that directly.
| Inclusion criterion | Players | Home/Away scoring-rate ratio |
|---|---|---|
| ≥4 goals; ≥400 min | 83 | 1.47 |
| ≥5 goals; ≥400 min | 68 | 1.54 |
| ≥6 goals; ≥400 min | 58 | 1.50 |
| ≥5 goals; ≥450 min | 66 | 1.51 |
Every scenario produced a very similar result.
In practical terms:
change the threshold, and the conclusion barely changes.
That consistency strengthens the interpretation considerably.
What the analysis does not tell us
A within-player comparison solves some methodological problems, but not all of them.
It controls naturally for many stable characteristics of the player, because the player is being compared with himself.
However, it does not isolate every contextual variable that differs between home and away matches.
The present analysis does not explicitly control for factors such as:
- opponent quality;
- starting versus substitute appearances;
- penalties;
- detailed positional role;
- game state;
- tactical strategy;
- team dominance;
- the spatial location of attacking possessions.
The results should therefore be interpreted as a strong association, not as proof that playing at home directly causes an individual player to score 54% more.
That limitation also points towards the next analytical step.
The next question may be more interesting than the first
We now know that, among these LALIGA EA SPORTS goalscorers, the same player generally produces considerably more goals at home.
We also know that the increase is accompanied by more shots, more shots on target and more expected goals.
What remains unanswered is what happens upstream of those shots.
Does the player receive the ball more frequently close to goal?
Does his team spend more time in advanced zones?
Does home possession generate more entries into dangerous areas?
Do the positions from which the striker receives the final pass change?
Does defensive behaviour from the opposition create different spaces?
Combining event and tracking data could move the analysis from describing the scoring difference towards explaining the tactical mechanisms that produce it.
Because perhaps the most useful conclusion is not simply that goalscorers score more at home.
It is that context appears to change how often the goalscorer reaches the situations from which goals become possible.