


18 Sep The DNA of a LALIGA Champion: What 15 Seasons Reveal Beyond Possession
Different champions. Different coaches. Different tactical ideas.
Yet across the last 15 complete LALIGA seasons, some performance characteristics keep appearing.
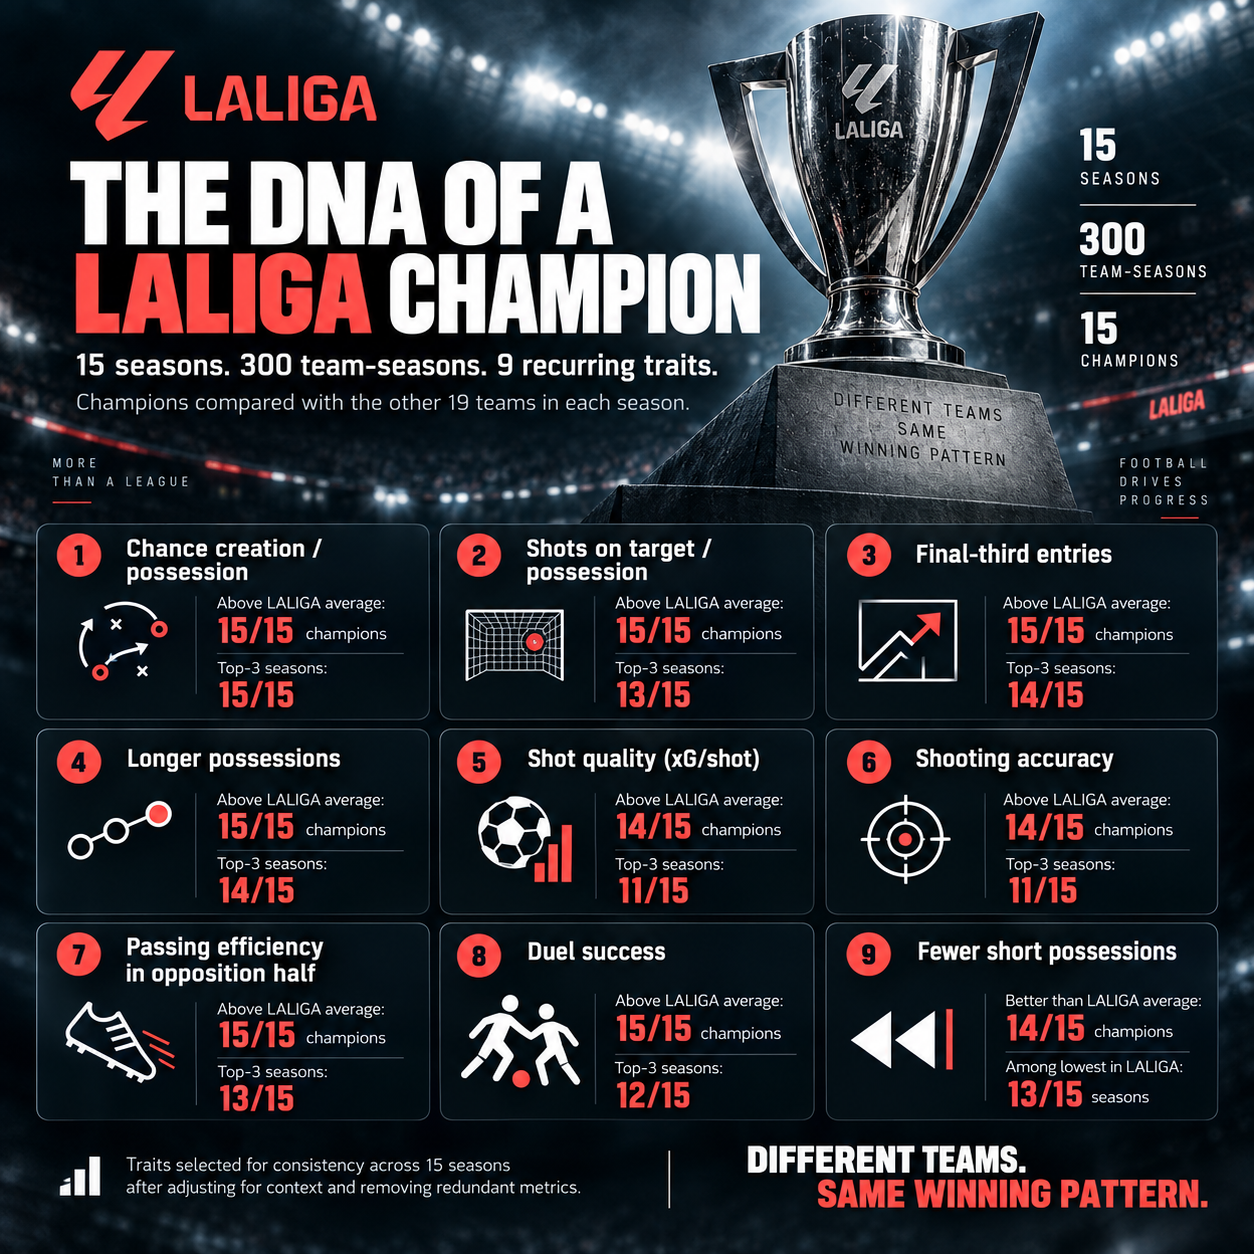
We analysed 300 team-seasons, comparing each champion with the other 19 teams from the same campaign. The objective was not to discover which teams had the most possession, completed the most passes or took the most shots.
That part is relatively predictable.
The more interesting question was:
Which characteristics still distinguish LALIGA champions once we separate genuine performance differences from the simple consequences of dominating more of the game?
The answer produces a much more specific picture of championship performance.
In short
Across 15 seasons, champions repeatedly showed a profile characterised by:
- more chance creation per possession;
- more shots on target per possession;
- greater ability to move possessions into the final third;
- longer, more developed possessions;
- better shot quality and shooting accuracy;
- greater passing efficiency in the opposition half;
- higher duel success;
- fewer possessions ending after only 0–2 passes.
But one of the most informative findings came from the variables that did not survive adjustment.
Champions committed fewer fouls, took more short corners and accumulated more 1v1 carries in raw numbers. Once those metrics were adjusted for the opportunities available to perform them, much of the apparent advantage disappeared.
That distinction — volume versus efficiency — is central to understanding the results.
Why raw numbers can mislead
Suppose the champion completes substantially more passes than the average LALIGA team.
That tells us something about dominance, but not necessarily about efficiency.
A team that spends more time in possession naturally accumulates more passes, touches, carries, attacking-third actions and shots. Likewise, a team that spends less time defending will often commit fewer fouls simply because it has fewer defensive minutes in which to foul.
The same underlying advantage can therefore appear simultaneously in many different variables.
Without adjustment, we risk interpreting one phenomenon — greater control of the game — as five or ten independent characteristics of championship performance.
For this reason, we did not simply rank 174 metrics and select the highest values.
How the champion profile was identified
The procedure had four steps.
First, every champion was compared only with the other 19 teams from its own season. Football evolves, so an absolute value from 2011/12 should not automatically be interpreted in the same way as the same value in 2025/26.
Second, we looked for recurrence. A spectacular value in one season is interesting, but it is not championship DNA. The relevant metrics were those appearing repeatedly across different champions and competitive contexts.
Third, highly correlated or conceptually redundant variables were reduced. Pass attempts, completed passes, touches and long sequences, for example, can all reflect the same possession-dominance phenomenon.
Finally, where appropriate, we adjusted for exposure: possessions, shots, passing volume, corners or time without the ball.
That final step changed several conclusions.
What disappeared when we adjusted for context?
This is perhaps the clearest example of why the methodology matters.
Fouls
In absolute terms, champions consistently committed fewer fouls.
Initially, this appeared to be a strong championship characteristic.
But after accounting for time spent without possession, the difference became much weaker.
The interpretation changes completely.
It is not necessarily that champions defend in a fundamentally less aggressive way. A substantial part of the raw difference simply reflects the fact that they spend less time defending.
Short corners
Champions also took more short corners.
However, when short corners were expressed relative to their total number of corners, the effect weakened considerably.
Again, part of the difference came from generating more corner situations in the first place.
1v1 carries
A similar pattern appeared with carrying and 1v1 volume.
Champions accumulated more of these actions, but they did not necessarily perform proportionally more 1v1 actions once total carrying volume was considered.
These examples highlight an important analytical principle:
Doing more is not automatically the same as doing something better or differently.
The most interesting championship characteristics are therefore those that remain after this distinction is made.
The nine recurring traits
The final profile is summarised below.
| Championship trait | Above league reference | Top/Bottom-3 |
|---|---|---|
| Chance creation per possession | 15/15 | 15/15 Top-3 |
| Shots on target per possession | 15/15 | 13/15 Top-3 |
| Possessions reaching the final third | 15/15 | 14/15 Top-3 |
| Longer possessions | 15/15 | 14/15 Top-3 |
| Shot quality — xG per shot | 14/15 | 11/15 Top-3 |
| Shooting accuracy | 14/15 | 11/15 Top-3 |
| Passing efficiency in opposition half | 15/15 | 13/15 Top-3 |
| Duel success | 15/15 | 12/15 Top-3 |
| Fewer possessions with 0–2 passes | 14/15 | 13/15 Bottom-3 |
Not all nine signals are equally strong.
Chance creation per possession is particularly striking: all 15 champions were above the seasonal reference, and all 15 ranked among the Top 3 teams.
Final-third progression and possession development are similarly stable.
Shot quality and shooting accuracy remain strongly recurrent, but they are not universal in the same way. That distinction matters: championship performance appears to have a core and a set of supporting characteristics rather than nine equally important ingredients.
1. Champions do more with possession
Perhaps the strongest overall finding is that possession volume alone does not explain the champion profile.
Every champion in the sample generated more chances per possession than the seasonal reference.
The same 15/15 pattern appeared for shots on target per possession.
This shifts the interpretation away from:
“Champions attack more because they have more of the ball.”
toward:
“Champions extract more attacking output from the possessions they have.”
For coaches and analysts, that distinction is much more actionable.
Two teams can finish a match with similar possession percentages while producing completely different levels of attacking threat.
Possession therefore needs to be assessed not only by how much a team has, but by what each possession produces.
2. Control is linked to progression, not circulation alone
Champions were above the league reference for final-third progression in 15/15 seasons, and Top-3 in 14.
They also tended to sustain longer possessions and show fewer possessions ending after only 0–2 passes.
This does not mean that champions avoid fast attacks or transitions.
Nor does it mean that long possession is intrinsically superior.
The more defensible interpretation is that champions repeatedly demonstrate the capacity to keep possession alive and move it into more threatening areas.
That is different from sterile circulation.
A useful distinction therefore emerges between:
ball control
and
productive ball control.
Possession becomes meaningful when it changes territory or increases attacking threat.
3. Champions combine shot volume with shot quality
The attacking difference does not finish with creating more opportunities.
Champions also produced a recurrent advantage in xG per shot and shooting accuracy.
Fourteen of the 15 champions were above their seasonal reference in both measures.
This is important because attacking performance can fail in two opposite ways:
a team can generate too few shots, or it can generate many shots from poor situations.
Championship teams tend to avoid that trade-off.
Their profile combines:
more productive possessions → more meaningful finishing opportunities → better average shot quality.
That should not be interpreted as a proven causal sequence. These are associated characteristics observed within the same performance profiles.
But from a coaching perspective, the combination matters more than any single metric.
4. Technical efficiency survives where the game becomes difficult
Champions were above the league reference for passing efficiency in the opposition half in all 15 seasons, ranking Top-3 in 13.
That makes this variable particularly interesting.
Passing percentages can be misleading when dominated by safe circulation in low-pressure zones. Maintaining efficiency closer to the opposition goal is a different challenge: space becomes smaller, defensive pressure increases and the cost of error becomes greater.
The champions’ advantage therefore appears not only in the quantity of possession, but in their capacity to maintain technical quality in areas where attacking actions become more difficult.
Duel success provides another example.
All 15 champions were above the league reference, with 12 finishing among the Top 3.
The effect is not as large as the strongest attacking indicators, but its consistency suggests that championship performance is not exclusively a possession phenomenon.
An interesting paradox: champions progress more without being more direct
One result deserves separate attention.
Champions completed more forward passes in absolute terms.
Yet forward passes represented a smaller proportion of their total passing volume.
There is no contradiction.
A team with much greater passing volume can produce more forward passes while simultaneously using them less frequently as a proportion of all passes.
This suggests an important distinction between:
absolute progression
and
relative directness.
Champions do not necessarily progress by forcing a greater proportion of actions forward.
Their greater control creates more opportunities to progress.
For coaches, this matters because “playing forward more often” and “progressing more effectively” are not synonymous.
What should coaches take from this?
The analysis does not provide a tactical recipe for becoming champion.
It does provide a useful framework for evaluating dominance.
Instead of stopping at:
How much possession do we have?
a staff can move through a more informative sequence of questions:
Can we sustain possession?
How often does possession collapse after only one or two passes?
Can we progress it?
What proportion of possessions reach advanced territory?
Can we create threat from it?
How many chances or shots on target are generated per possession?
What quality of finishing opportunity are we producing?
What is the xG value of the average shot?
This changes the analytical emphasis from volume to functionality.
A team may dominate possession without dominating these outcomes.
Conversely, improving these outcomes does not necessarily require copying the tactical structure of Barcelona, Real Madrid or Atlético de Madrid.
The route can differ.
The performance objectives appear much more stable.
Five dimensions behind the nine metrics
Although nine indicators survived the final selection, they should not be interpreted as nine independent ingredients.
They can be condensed into approximately five football dimensions:
Possession development
Ability to sustain possessions and avoid immediate breakdowns.
Territorial progression
Ability to transform possession into advanced field position.
Chance creation
Ability to convert possession into meaningful attacking opportunities.
Finishing quantity and quality
Ability to produce shots on target and generate valuable shooting situations.
Technical efficiency
Ability to maintain passing and duel performance in demanding contexts.
This distinction is important because modern datasets can easily create the illusion that dozens of variables independently explain performance.
Often, they are different statistical expressions of the same football behaviour.
Different styles, similar outcomes
There is clearly no single LALIGA championship style.
The champions included in these 15 seasons were produced by different coaches, squads and tactical models.
Some controlled matches through long possession phases.
Others were more comfortable attacking open spaces.
Some defended higher; others protected deeper areas more frequently.
The analysis does not say that these differences are irrelevant.
It says something else.
Beneath those tactical differences, the performance outcomes associated with championship teams are surprisingly recurrent.
They sustain possession.
They advance it.
They create more threat from it.
And they generally arrive at better finishing situations.
The tactical route changes.
The performance destination appears much more stable.
Methodological note
The dataset contains 15 complete LALIGA seasons and 300 team-season observations.
Each champion was compared with the other 19 teams from the same campaign rather than directly comparing raw values across different historical periods.
Metrics were evaluated according to their within-season differential, consistency across seasons and frequency of Top-3 or Bottom-3 rankings. Highly correlated and conceptually overlapping variables were reduced to avoid representing the same underlying behaviour multiple times.
Where appropriate, raw volumes were additionally adjusted for relevant exposure — including possessions, shots, passing volume, corners or time without possession.
The objective is therefore descriptive and comparative, not causal. The analysis identifies characteristics that repeatedly coexist with championship performance; it does not demonstrate that changing any one of these metrics would cause a team to win LALIGA.