


30 Sep Football is not 4-4-2 vs 4-2-3-1 at kick-off
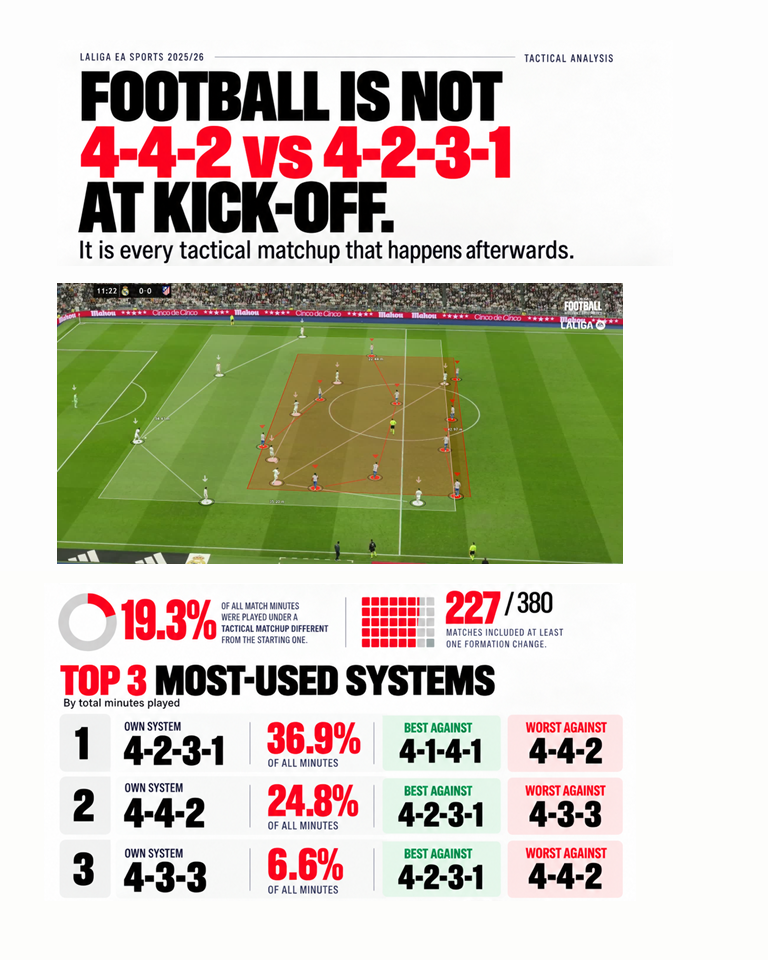
In LALIGA EA SPORTS 2025/26, one in every five minutes was played under a tactical matchup different from the one seen at kick-off. The starting formation is not the match. It is only its first frame.
A football match is often described before it begins.
One team plays 4-3-3. The other plays 4-4-2. The graphic appears on screen. The tactical story seems settled.
It rarely is.
Across all 380 matches of LALIGA EA SPORTS 2025/26, we reconstructed the time each team spent in every formation and crossed both sequences to identify the tactical matchup being played throughout the match.
The result is clear.
19.2% of all match minutes were played under a matchup different from the starting one.
And in 227 of 380 matches — 59.7% — at least one team changed its formation.
Almost six matches in ten therefore contained a tactical relationship that changed after kick-off.
That is too much football to ignore.
Why this matters
Imagine a match that begins:
4-4-2 vs 4-2-3-1
Twenty minutes later it becomes:
4-3-3 vs 4-2-3-1
And later:
4-3-3 vs 5-4-1
If we analyse only the starting formations, all three situations are reduced to the first one.
The pre-match graphic tells us how the game starts.
It does not necessarily tell us how the game is played.
Two systems dominate. A third follows at a distance
Measured by total team-minutes, the three most-used structures were:
- 4-2-3-1 — 36.9%
- 4-4-2 — 24.8%
- 4-3-3 — 6.6%
The first two alone accounted for more than 60% of all formation minutes.
But frequency is only half of the story.
A 4-2-3-1 against another 4-2-3-1 is not the same tactical problem as a 4-2-3-1 against a 4-4-2.
The label is the same.
The opponent is not.
The matchup changes the picture
To avoid giving weight to marginal pairings, the league-wide comparison below considers only sufficiently exposed matchups.
| Own formation | More present in wins against | More present in losses against |
|---|---|---|
| 4-2-3-1 | 4-1-4-1 | 4-4-2 |
| 4-4-2 | 4-2-3-1 | 4-3-3 |
| 4-3-3 | 4-2-3-1 | 4-4-2 |
For the 4-2-3-1, minutes against a 4-1-4-1 represented 11.7% of its minutes in matches eventually won, compared with 4.5% in matches eventually lost: a difference of +7.2 percentage points.
Against a 4-4-2, the pattern moved in the opposite direction: 21.3% of winning-match minutes versus 27.6% of losing-match minutes, a difference of −6.3 points.
The 4-4-2 showed the reverse relationship against the 4-2-3-1: 38.7% of winning-match minutes versus 31.0% of losing-match minutes, a +7.7-point differential.
Against a 4-3-3, its differential was −5.0 points.
For the 4-3-3, the signal was much weaker: +2.1 points against 4-2-3-1 and −1.3 against 4-4-2.
That last result matters. Not every matchup produces a strong pattern. Sometimes the data say very little. That is preferable to forcing a story where there is none.
These differentials compare each matchup with the formation’s own distribution between matches won and lost. They are not a probability that one system will beat another.
League averages hide team identities
The aggregate picture is useful.
It is also incomplete.
The same formation can mean very different things for different teams.
A club that spends almost the entire season in one structure asks a different tactical question from a club that constantly changes shape.
For that reason, we repeated the analysis at team level.
For every club, every tactical pairing can be represented using two dimensions:
- horizontal axis: its share of minutes in matches the team eventually lost;
- vertical axis: its share of minutes in matches the team eventually won.
The diagonal is the reference line.
A matchup well above it was proportionally more present in victories.
A matchup well below it was proportionally more present in defeats.
A matchup close to the diagonal was common in both contexts. It may define the team’s tactical environment without distinguishing success from failure.
That distinction is important.
Frequency is not advantage.
Three very different tactical fingerprints
Villarreal: stability
Villarreal spent 94.8% of its minutes in 4-4-2.
For Villarreal, the interesting question is therefore not which system it uses. That answer is almost predetermined.
The question is what that 4-4-2 is facing.
Its most common matchup was:
4-4-2 → 4-2-3-1
Its most win-skewed sufficiently exposed pairing was:
4-4-2 → 3-4-2-1
Its most loss-skewed:
4-4-2 → 5-3-2
One structure. Different environments. Different outcomes.
Sevilla: variety
At the other extreme, Sevilla’s most-used formation — 4-2-3-1 — accounted for only 29.0% of its minutes.
No single structure came close to defining its season.
That changes the analytical question.
With Villarreal, the variation comes mostly from the opponent.
With Sevilla, it comes from both sides.
The same league can therefore contain a highly stable tactical identity and a highly distributed one.
A single formation label describes the former reasonably well.
It describes the latter much less well.
Valencia: a strong opponent-dependent pattern
Valencia used 4-4-2 in 58.5% of its minutes.
The pairing:
4-4-2 → 4-2-3-1
was particularly asymmetric.
It represented a much larger share of Valencia’s minutes in matches eventually won than in matches eventually lost: +28.7 percentage points, across 927 minutes and 14 matches.
That does not prove that a 4-4-2 gives Valencia an inherent advantage over a 4-2-3-1.
It does show that this specific tactical environment was strongly associated with the team’s successful match outcomes during the season.
That is a different claim.
And a more defensible one.
The tactical fingerprint of every team
For the club-level comparison below, only matchups with at least 150 accumulated minutes and presence in at least three matches were considered when identifying the most win- and loss-skewed pairings.
Own → Opponent
| Team | Most-used formation | Most common matchup | More present in wins | More present in losses |
|---|---|---|---|---|
| Barcelona | 4-2-3-1 — 71.3% | 4-2-3-1 → 4-2-3-1 | 4-2-3-1 → 4-2-3-1 (+8.9 pp) | 4-2-3-1 → 4-4-2 (−3.9 pp) |
| Real Madrid | 4-4-2 — 42.6% | 4-4-2 → 4-2-3-1 | 4-3-3 → 4-4-2 (+10.8) | 4-2-3-1 → 4-4-2 (−15.4) |
| Villarreal | 4-4-2 — 94.8% | 4-4-2 → 4-2-3-1 | 4-4-2 → 3-4-2-1 (+11.2) | 4-4-2 → 5-3-2 (−14.7) |
| Atlético de Madrid | 4-4-2 — 61.8% | 4-4-2 → 4-2-3-1 | 4-4-2 → 4-2-3-1 (+11.8) | No eligible matchup below the reference line |
| Real Betis | 4-2-3-1 — 75.8% | 4-2-3-1 → 4-2-3-1 | 4-3-3 → 4-2-3-1 (+6.5) | 4-2-3-1 → 4-3-3 (−11.8) |
| Celta | 3-4-3 — 70.3% | 3-4-3 → 4-2-3-1 | 3-4-2-1 → 4-4-2 (+5.4) | 3-4-3 → 4-4-2 (−9.6) |
| Getafe | 5-3-2 — 46.4% | 5-3-2 → 4-2-3-1 | 5-3-2 → 4-4-2 (+14.6) | 4-4-2 → 4-4-2 (−19.1) |
| Rayo Vallecano | 4-2-3-1 — 62.6% | 4-2-3-1 → 4-2-3-1 | 4-2-3-1 → 4-4-2 (+17.6) | 4-4-2 → 3-4-3 (−14.7) |
| Valencia | 4-4-2 — 58.5% | 4-4-2 → 4-2-3-1 | 4-4-2 → 4-2-3-1 (+28.7) | No eligible matchup below the reference line |
| Real Sociedad | 4-4-2 — 33.4% | 4-1-4-1 → 4-2-3-1 | 4-2-3-1 → 4-2-3-1 (+15.2) | 4-2-3-1 → 4-4-2 (−25.2) |
| Espanyol | 4-2-3-1 — 41.8% | 4-4-2 → 4-2-3-1 | 4-4-2 → 4-2-3-1 (+19.5) | 4-2-3-1 → 4-4-2 (−20.4) |
| Athletic Club | 4-2-3-1 — 95.1% | 4-2-3-1 → 4-2-3-1 | 4-2-3-1 → 4-2-3-1 (+26.1) | 4-2-3-1 → 4-4-2 (−19.7) |
| Sevilla | 4-2-3-1 — 29.0% | 4-2-3-1 → 4-2-3-1 | 5-3-2 → 4-4-2 (+10.9) | No meaningful eligible negative differential |
| Alavés | 4-4-2 — 42.7% | 4-4-2 → 4-2-3-1 | 4-4-2 → 4-4-2 (+15.6) | 4-1-4-1 → 4-2-3-1 (−13.5) |
| Elche | 3-5-2 — 33.5% | 4-1-4-1 → 4-2-3-1 | 3-5-2 → 5-3-2 (+10.6) | 4-1-4-1 → 4-2-3-1 (−18.7) |
| Levante | 4-2-3-1 — 33.0% | 4-2-3-1 → 4-2-3-1 | 4-1-4-1 → 4-2-3-1 (+4.1) | 4-2-3-1 → 4-2-3-1 (−16.8) |
| Osasuna | 4-2-3-1 — 52.4% | 4-2-3-1 → 4-2-3-1 | 4-2-3-1 → 4-4-2 (+12.9) | 4-2-3-1 → 4-2-3-1 (−2.4) |
| Mallorca | 4-2-3-1 — 49.0% | 4-2-3-1 → 4-2-3-1 | 4-2-3-1 → 4-1-4-1 (+10.9) | No meaningful eligible negative differential |
| Girona | 4-2-3-1 — 50.3% | 4-2-3-1 → 4-2-3-1 | 4-2-3-1 → 4-2-3-1 (+10.4) | 4-5-1 → 4-4-2 (−10.6) |
| Real Oviedo | 4-2-3-1 — 69.3% | 4-2-3-1 → 4-2-3-1 | 4-2-3-1 → 4-3-3 (+11.9) | 4-2-3-1 → 5-3-2 (−4.2) |
The table is not a league table of tactical superiority.
It is a map of exposure.
That is a more useful distinction.
Method and limitations
The analysis covers all 380 LALIGA EA SPORTS 2025/26 matches.
Formation sequences were reconstructed from the reported duration and order of the formations used by each team. The dataset provides the duration of each formation, not the exact timestamp of every tactical change.
Each team’s sequence was crossed with its opponent’s sequence to estimate the minutes spent in every tactical pairing.
“Minutes in wins” means minutes played in matches the team eventually won. It does not mean that the team was leading during those minutes. The same applies to defeats.
Draws were excluded from the win-loss differential.
The analysis is descriptive. It does not control for:
- team quality;
- match state;
- score at the moment of the tactical change;
- substitutions;
- red cards;
- opponent strength;
- the tactical reason behind a change;
- behavioural differences hidden within the same nominal formation.
A team may change system because it is already winning.
Or because it is already losing.
The direction of causality cannot be established here.
That is why these results should be read as associations between tactical environments and final match outcomes, not as evidence that one formation inherently beats another.
A formation is not a result
Two teams can both play 4-2-3-1.
Their football need not resemble each other.
The same team can also play 4-2-3-1 against two different opponents and face two entirely different tactical problems.
That is why the formation alone is an incomplete unit of analysis.
It tells us how a team is arranged.
It does not tell us what that arrangement is interacting with.
And over an entire season, that interaction changes constantly.
The starting formation is not the match. It is only its first frame.
The formation is only one half of the tactical sentence.
The opponent writes the other.