


17 Jul When Position Changes, Performance Metrics Change Too: Positional Versatility in LALIGA 2025/26
A player is often described as versatile when he can play in several positions. However, a brief appearance in a secondary role is not the same as performing there regularly, and moving between two nearby attacking positions is not equivalent to switching from central defence to midfield.
Positional versatility should therefore not be measured by simply counting position labels. Playing time, the distribution of those minutes and the functional distance between positions all matter.
This is more than a question of squad flexibility. When the same player performs in different areas of the pitch, the opportunities available to him also change. He may receive the ball more often, attempt safer passes, defend different spaces or face different levels of pressure. As a result, a change of position can also change the meaning of his performance metrics.
Using aggregated player-position data from the complete 2025/26 LALIGA EA SPORTS season, this analysis examines how positional versatility was distributed across teams, where the strongest positional overlaps occurred and why those movements matter when evaluating individual performance.
Which teams used positional versatility most?
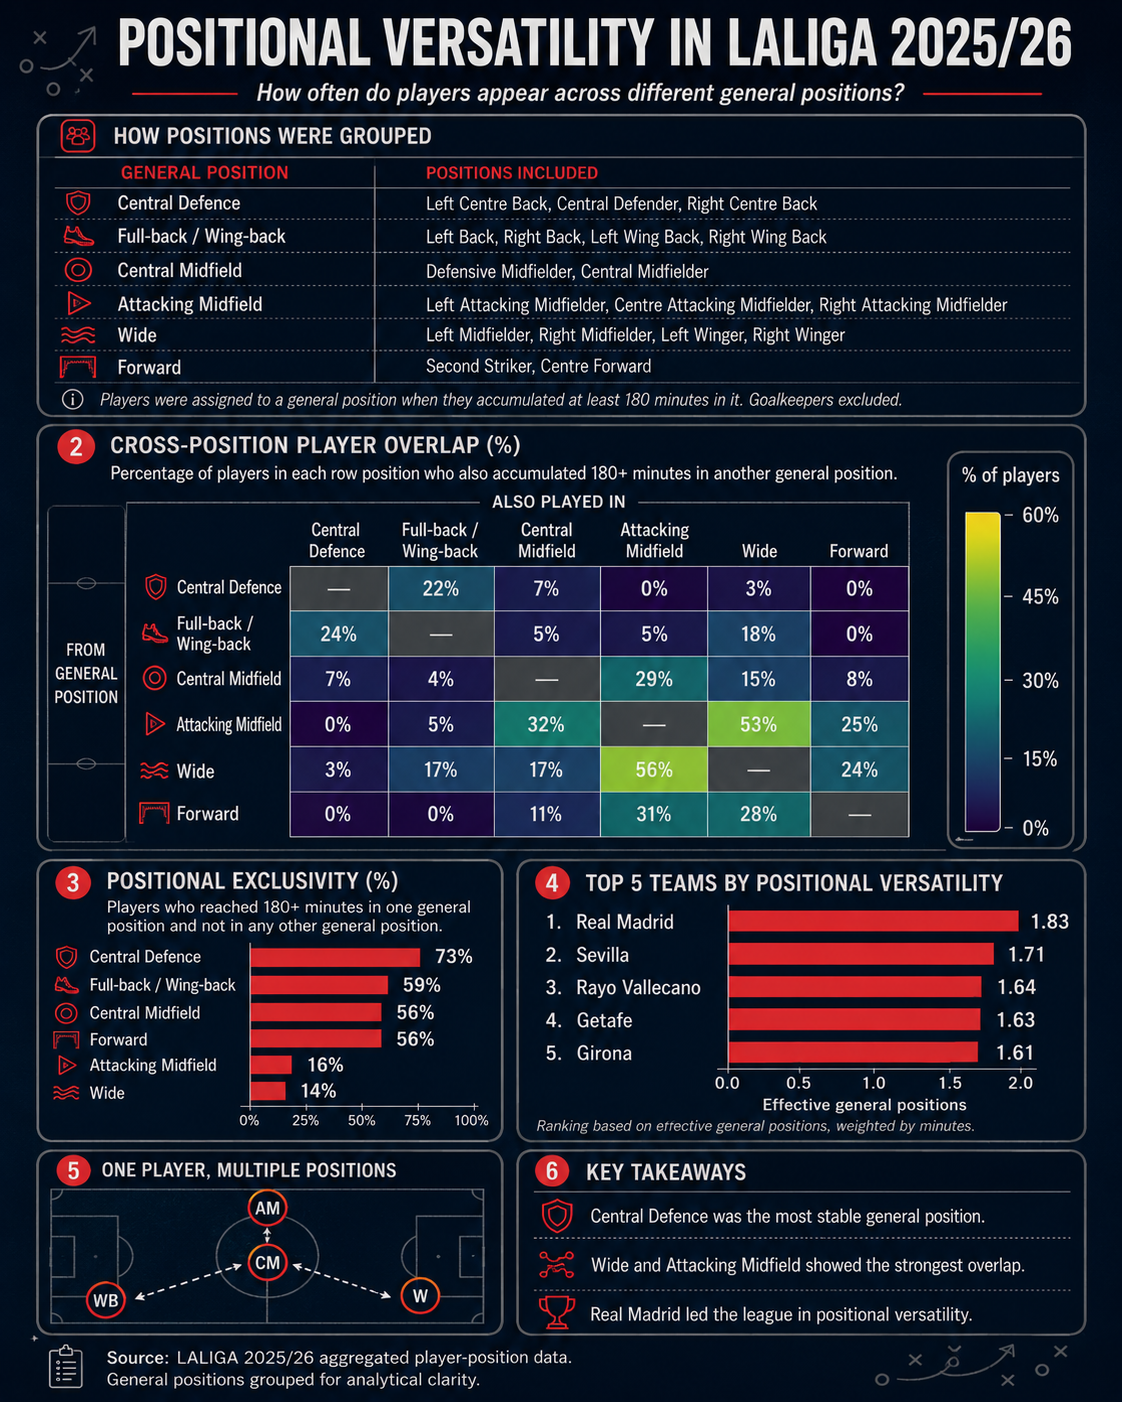
Team positional versatility was measured through the number of effective general positions occupied by each player, weighted by the minutes accumulated in them. A brief appearance in an alternative position therefore carries little weight, while sustained use across two or more positions contributes substantially more.
| Rank | Team | Effective general positions | Minutes played by versatile players | Minutes outside primary position |
|---|---|---|---|---|
| 1 | Real Madrid | 1.83 | 63.7% | 25.1% |
| 2 | Sevilla | 1.71 | 81.9% | 23.7% |
| 3 | Rayo Vallecano | 1.64 | 58.4% | 21.6% |
| 4 | Getafe | 1.63 | 52.6% | 20.1% |
| 5 | Girona | 1.61 | 69.1% | 20.1% |
Real Madrid recorded the highest number of effective general positions and the largest proportion of minutes outside players’ primary positions among the top five teams. Its versatile players accumulated 25.1% of their minutes away from their main positional category.
Sevilla reached second place through a different pattern. Although its overall positional score was lower, 81.9% of its total minutes were contributed by players who reached the required threshold in more than one general position. In other words, Real Madrid showed greater positional distribution, whereas Sevilla relied more extensively on multi-position players across the season.
This distinction matters because versatility can be concentrated in a small number of key players or distributed across much of the squad. The ranking captures both patterns, but it should not be interpreted as a measure of tactical quality. A high score may reflect planned flexibility, although it may also be influenced by injuries, suspensions or instability.
How the positions were grouped
The original match positions were grouped into six broader outfield categories. A player was assigned to one of them when he accumulated at least 180 minutes in that category. Goalkeepers were excluded.
| General position | Detailed positions included |
|---|---|
| Central Defence | Left Centre Back, Central Defender, Right Centre Back |
| Full-back / Wing-back | Left Back, Right Back, Left Wing Back, Right Wing Back |
| Central Midfield | Defensive Midfielder, Central Midfielder |
| Attacking Midfield | Left Attacking Midfielder, Centre Attacking Midfielder, Right Attacking Midfielder |
| Wide | Left Midfielder, Right Midfielder, Left Winger, Right Winger |
| Forward | Second Striker, Centre Forward |
This grouping avoids treating every change in the detailed positional label as a meaningful transition. A player moving from Right Back to Left Wing Back, for example, remains within the broader Full-back / Wing-back category. The analysis therefore focuses on movements between functionally different areas.
Positional anchors and positional bridges
Central Defence was the clearest positional anchor. Among players who reached 180 minutes there, 73% did not reach the same threshold in any other general position.
Its main overlap was with Full-back / Wing-back. Twenty-two per cent of central defenders also accumulated substantial minutes in that category, while 24% of full-backs and wing-backs also played in Central Defence. By contrast, only 7% of central defenders reached the threshold in Central Midfield, and overlaps with more advanced positions were almost nonexistent.
This stability reflects the specificity of the position. Central defenders must protect depth, manage the defensive line, defend the penalty area and make decisions in zones where errors carry a particularly high cost. Moving a player into Central Defence usually changes more than his starting location: it changes his relationship with space, risk and defensive responsibility.
The opposite pattern appeared in advanced areas. Only 14% of Wide players and 16% of Attacking Midfield players were exclusive to those categories.
The strongest overlap in the competition connected them directly. Fifty-six per cent of Wide players also accumulated at least 180 minutes in Attacking Midfield, while 53% of Attacking Midfield players reached the threshold in Wide positions.
These figures suggest that Wide and Attacking Midfield should not be treated as completely separate player populations. Instead, they form an interconnected attacking space in which players may start from the flank, move into the half-space or operate between the opposition’s midfield and defensive lines depending on the team’s formation and attacking structure.
Central Midfield occupied a more stable but still highly connected position. Its exclusivity was 56%, and its strongest overlap was with Attacking Midfield. Twenty-nine per cent of central midfielders also accumulated substantial minutes in the advanced category, while 32% of attacking midfielders reached the threshold in Central Midfield.
Forward showed the same exclusivity as Central Midfield, at 56%, but remained closely connected to the attacking positions behind it. Thirty-one per cent of forwards also played in Attacking Midfield and 28% accumulated substantial minutes in Wide positions.
Overall, the positional structure is relatively clear. Central Defence acts mainly as an anchor, Full-back / Wing-back connects defence with the flanks, Central Midfield links deeper and more advanced central areas, and the strongest circulation of players occurs among Attacking Midfield, Wide and Forward.
Why this matters for coaches
For coaches, positional versatility affects squad construction, tactical preparation and in-match decision-making. A player capable of performing reliably in several general positions may reduce the need for duplicated profiles and increase the number of structures available without substitutions.
The same starting eleven can form a back four or a back three, move a midfielder into the first build-up line or transform a wide player into an interior attacker. This flexibility can help a team respond to the opposition’s press, create an overload or modify its defensive structure during the match.
It also changes opposition analysis. Predicting the starting line-up may be insufficient when the same players can create several positional configurations. In those cases, the relevant question is not only who will start, but what structures those players can form.
However, positional versatility and positional adaptability are not the same. The data shows where a player accumulated meaningful minutes; it does not establish whether he performed each role equally well. A versatile player has been used in different positions, whereas an adaptable player responds effectively to their different demands. Answering the second question requires match context and a deeper performance evaluation.
The same player, different metric meaning
The most important implication appears when positional versatility is connected to performance analysis.
Four high-frequency variables were examined: passes attempted per 90 minutes, touches per 90, pass completion percentage and recoveries per 90. The strongest positional dependency appeared in passes attempted, followed by touches, pass completion and recoveries.
The expected differences between positions are not the main finding. It is already well established that central defenders, midfielders and forwards operate in different contexts. More importantly, these changes also appeared when comparing the same player across different general positions.
Passing volume does not depend exclusively on technical ability or willingness to participate. It is shaped by where the player operates, how often the ball reaches that area, the team’s build-up structure and the passing options available around him.
Touches follow the same logic. A central defender may accumulate more touches than a forward without exerting greater influence on the decisive phases of attack.
Pass completion also changes meaning across positions. A defender completing 92% of his passes and an attacking midfielder completing 82% are not necessarily displaying different technical levels. The distance, direction, pressure and risk associated with their passes may be completely different.
Although recoveries were the least position-dependent of the four variables, they were still influenced by defensive height, collective behaviour and the areas occupied by the player.
Performance metrics therefore reflect both the individual and the tactical environment in which he operates. Part of the observed output belongs to the player, but another part is generated by the opportunities and constraints associated with the position.
Why global comparisons can mislead
This positional dependency limits the value of global player comparisons, particularly for volume-based metrics. A reduction in passes or touches may indicate a decline in involvement, but it may also reflect a more advanced position, a different build-up role or a change in team structure.
For recruitment and performance analysis, positional context is not an optional layer added after calculating the metric. It is part of what gives the metric meaning. Players should therefore be assessed within comparable positional and tactical contexts whenever possible.
Methodological considerations
The analysis covers the complete 2025/26 LALIGA EA SPORTS season and uses aggregated player-position data. A minimum of 180 minutes was required for a player to be assigned to a general position.
The cross-position overlap matrix reports the percentage of players in each row category who also reached 180 minutes in another general position. Because each row has a different denominator, the matrix is directional. For example, 56% of Wide players also played in Attacking Midfield, whereas 53% of Attacking Midfield players also played in Wide positions.
The diagonal is not treated as a transition. Positional exclusivity is reported separately and represents the percentage of players who reached the threshold in one category but not in any other.
The team ranking describes positional use through the number of effective general positions, weighted by minutes, together with the proportion of minutes contributed by multi-position players and the proportion played outside their primary positions. It does not directly measure tactical quality, player performance or the reasons behind each positional decision.
Finally, the six general categories necessarily simplify the complexity of tactical roles. Two players assigned to the same general position may receive different instructions depending on the system, phase of play and opposition. The grouping identifies broad patterns, but it does not replace match-level tactical analysis.
Final perspective
Real Madrid showed the highest effective positional versatility in LALIGA 2025/26, while Sevilla relied on multi-position players for the greatest share of playing time among the leading teams.
Across the competition, Central Defence remained the clearest positional anchor, whereas Wide and Attacking Midfield formed the strongest area of overlap.
These findings are useful for understanding how squads are built and how teams can change structure. Their deeper analytical value, however, lies elsewhere.
When a player changes position, the opportunities available to him change as well. The same footballer may pass more, touch the ball more often or complete a higher percentage of passes without any fundamental change in ability.
The position does not simply describe where the player performs. It also changes what his performance metrics mean.