


15 Jul Post-Loss Defensive Response: Measuring What Happens After a Team Loses the Ball
Possession tells us how a team attacks. What happens immediately after possession is lost may tell us whether that attack is sustainable.
This question becomes especially relevant for dominant teams. The more players they commit ahead of the ball, the greater the potential attacking reward—but also the greater the risk if the opponent escapes the first pressure.
The debate surrounding Spain during the 2026 World Cup offers a timely example. Luis de la Fuente’s team have reached the final through a proactive, possession-based approach, yet several opponents have tried to exploit the moments immediately after regaining the ball.
This article is not an analysis of Spain. It uses that debate as a starting point for a broader question:
How can we measure a team’s collective defensive response after losing possession?
To explore it, we developed a Post-Loss Defensive Response Index using full-season data from LALIGA EA SPORTS 2025/26.
The result
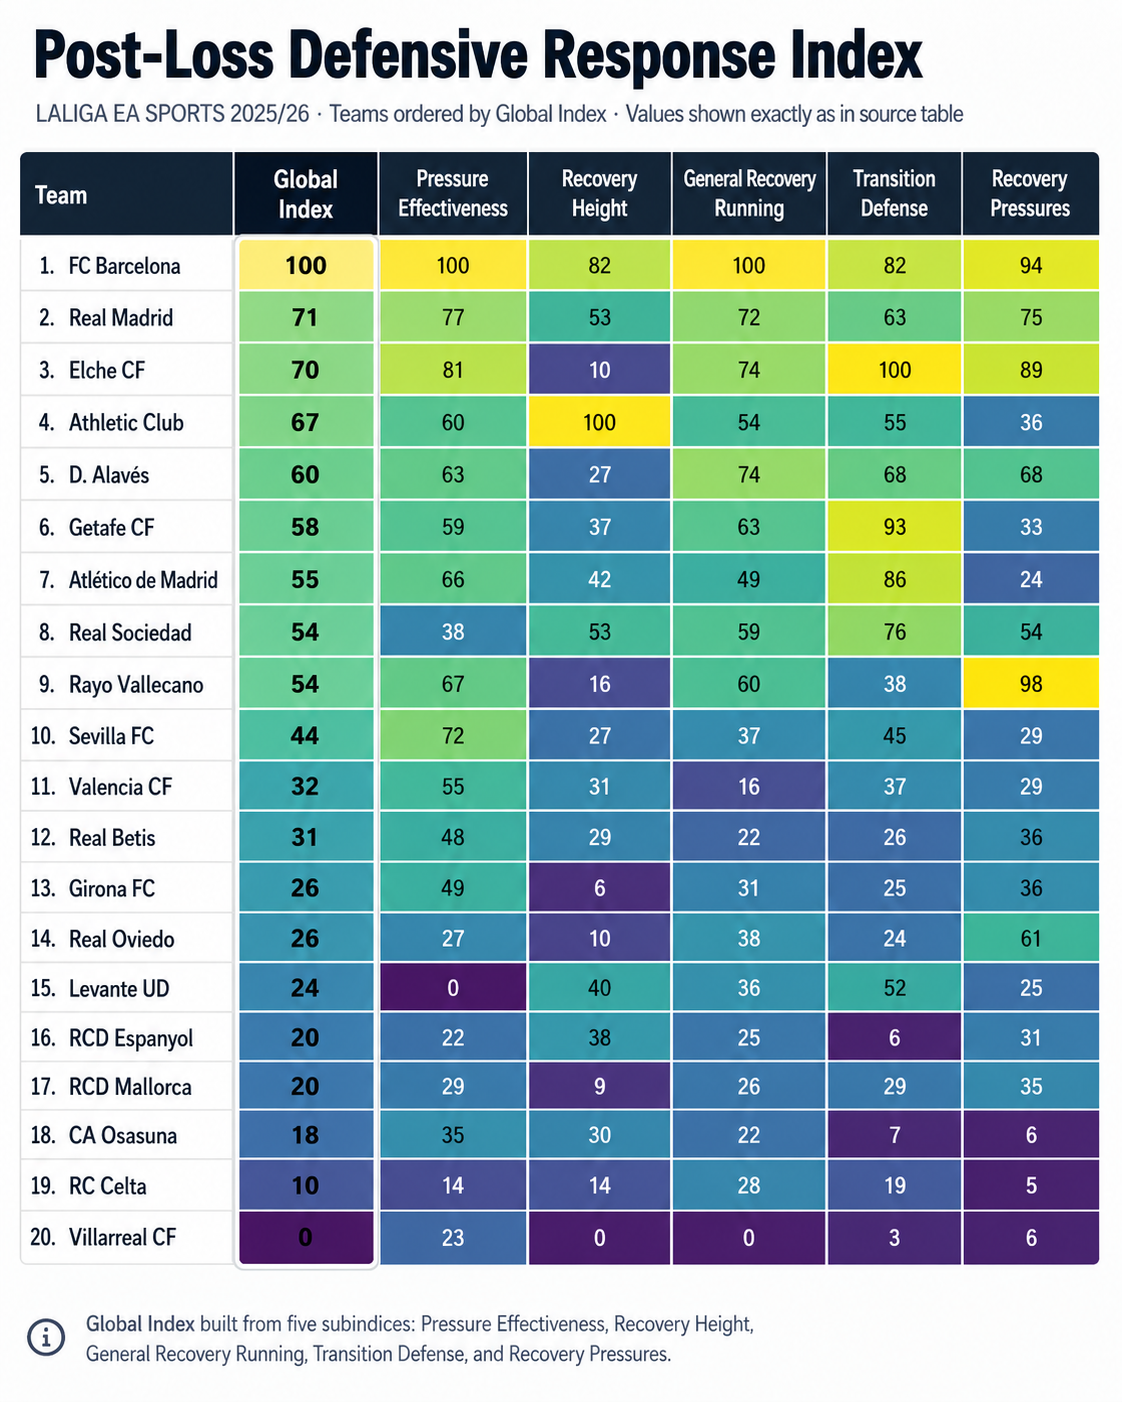
The index ranks FC Barcelona first, followed by Real Madrid, Elche CF and Athletic Club.
| Rank | Team | Global Index |
|---|---|---|
| 1 | FC Barcelona | 100 |
| 2 | Real Madrid | 71 |
| 3 | Elche CF | 70 |
| 4 | Athletic Club | 67 |
| 5 | Deportivo Alavés | 60 |
| 6 | Getafe CF | 58 |
| 7 | Atlético de Madrid | 55 |
| 8 | Real Sociedad | 54 |
| 9 | Rayo Vallecano | 54 |
| 10 | Sevilla FC | 44 |
| 11 | Valencia CF | 32 |
| 12 | Real Betis | 31 |
| 13 | Girona FC | 26 |
| 14 | Real Oviedo | 26 |
| 15 | Levante UD | 24 |
| 16 | RCD Espanyol | 20 |
| 17 | RCD Mallorca | 20 |
| 18 | CA Osasuna | 18 |
| 19 | RC Celta | 10 |
| 20 | Villarreal CF | 0 |
The ranking is useful, but it is not the main result.
The more relevant question is:
How does each team regain control after losing the ball?
Different teams can obtain similar global values through very different mechanisms. Some recover high. Others rely on backward pressure, high-intensity recovery running or transition defence.
That is why the global index must always be read alongside its five subindices.
What does the index measure?
The index does not evaluate overall defensive quality.
It does not directly measure penalty-area defending, duel success, goals conceded or low-block organisation. It focuses on a more specific phase:
The way a team pressures, recovers, runs backwards and defends transitions after losing control of the ball.
A successful post-loss response can take several forms:
- immediate ball recovery;
- pressure that forces the opponent backwards;
- delay of the transition;
- recovery of defensive structure;
- high-intensity running when the first pressure is broken.
The model therefore combines pressure, recovery location and defensive running rather than reducing post-loss behaviour to one action.
Why absolute values can mislead
Many post-loss metrics depend heavily on how long a team spends without the ball.
A team with less possession naturally has more opportunities to:
- press;
- make recovery runs;
- cover defensive distance;
- face opposition transitions.
This creates an exposure problem.
In the aggregated data, many absolute defensive volumes were negatively correlated with points. Teams accumulating more recovery pressures, defensive running and high-intensity distance generally obtained fewer points.
That does not mean pressing or recovery running are harmful.
It more likely means those teams:
- spent longer without possession;
- faced more transitions;
- were forced to defend more frequently;
- accumulated actions because of necessity rather than superiority.
Absolute values therefore answer:
How much defensive recovery work did the team perform?
They do not necessarily answer:
How actively or effectively did the team defend during the time it was without possession?
Normalising by minutes without possession
To reduce the effect of defensive exposure, all volume metrics were normalised by minutes without possession:Metric per 90 minutes without possession=Minutes without possessionMetric×90
This changes the interpretation.
For example:
- total recovery pressures reflect accumulated defensive work;
- recovery pressures per 90 minutes without possession reflect how frequently the team performs that behaviour while defending.
Normalisation does not transform the variables into pure measures of quality. They still reflect style, match context and attacking structure. However, it allows a fairer comparison between teams with very different possession profiles.
Two variables were not normalised:
- percentage of ball pressures leading to recovery, because it is already a rate;
- average open-play recovery height, because it is already an average spatial value.
The five subindices
1. Pressure Effectiveness
This subindex measures the proportion of ball pressures that lead to a recovery:Pressure Effectiveness=Total ball pressuresBall pressures leading to recovery
It is the clearest efficiency component in the model.
A team may press frequently but recover the ball rarely. Another may apply fewer pressures but convert a greater proportion into regains.
For a coach, this immediately raises practical questions:
- Does the nearest player press while teammates close the next passing options?
- Is the opponent being directed towards a prepared trap?
- Are the distances between lines short enough to contest the next action?
- Does the pressure recover possession or merely delay progression?
Pressure effectiveness had the strongest positive relationship with points among the dimensions included.
2. Recovery Height
This subindex represents the average location of open-play recoveries, measured in metres from the team’s own goal.
A higher value means the team tends to regain possession further from its own goal.
Recovering high can:
- shorten the distance to the opponent’s goal;
- sustain territorial dominance;
- attack before the opponent reorganises;
- prevent the rival from consolidating possession.
However, recovery height is not universally positive in isolation. Some teams intentionally defend deeper and recover effectively in lower zones.
The value of recovering high depends on whether the team can also protect the space behind its structure when the first pressure fails.
3. General Recovery Running
This subindex captures high-intensity defensive support runs towards the team’s own goal, starting in the opposition half and performed above 20 km/h.
It reflects the collective effort required to recover position after the attacking structure has been bypassed.
This metric must be interpreted carefully.
High recovery running may indicate:
- strong defensive commitment and reaction;
- repeated tactical exposure;
- both at the same time.
A team with high recovery running and high pressure effectiveness may be showing an aggressive and coordinated response.
A team with high recovery running but low pressure effectiveness may be repeatedly chasing opponents after the first pressure has failed.
4. Transition Defence
This dimension combines:
- high-intensity transition recovery runs;
- distance covered during those runs;
- sprinting transition recovery runs.
These actions occur while the opponent has possession, begin in the opposition half and finish in the team’s own half.
The high-intensity threshold is above 20 km/h. Sprinting transition recovery runs exceed 25 km/h.
The three variables provide different information:
- frequency;
- distance;
- extreme-speed demand.
They were retained because they add tactical detail, but grouped within one subindex to avoid giving the same behavioural family several independent weights.
For a coaching staff, this dimension can point towards different issues:
- poor rest-defence positioning;
- too many players ahead of the ball;
- insufficient protection of central spaces;
- ineffective delaying actions;
- excessive open-field exposure.
The data shows the physical response generated by the situation. Video is still necessary to determine whether the decisions and running directions were tactically correct.
5. Recovery Pressures
This subindex combines:
- recovery ball pressures;
- distance covered during those pressures;
- high-intensity recovery ball pressures;
- high-intensity distance during recovery ball pressures.
A recovery ball pressure is performed in a backwards direction, towards the team’s own goal.
This differs from a stable forward press. The team may already be retreating, and the objective may not be immediate recovery.
The pressure can also aim to:
- slow the ball carrier;
- prevent a forward pass;
- force play towards the touchline;
- protect central spaces;
- buy time for teammates to recover;
- convert an open transition into an organised attack.
Again, frequency, distance and high-intensity involvement add different detail, but belong to the same defensive family.
How the index was constructed
1. Metric selection
Only aggregated metrics showing a positive correlation with points were included in the performance-oriented version of the index.
This does not make negatively correlated variables irrelevant. Their negative relationship with points was itself informative: absolute defensive volume often reflected defensive necessity rather than defensive superiority.
2. Transformation to a 0–100 scale
Each metric was converted using min–max normalisation:Metric Indexi=100×max(x)−min(x)xi−min(x)
The highest team receives 100 and the lowest receives 0.
This was necessary because the original variables use different units: percentages, metres, actions and distances.
The scores are therefore relative to the 20 LALIGA teams in the 2025/26 season. They are not universal benchmarks.
3. Grouping related variables
Several variables were highly correlated with each other.
For example:
- teams performing more recovery pressures also accumulated more distance during those actions;
- the number and distance of transition recovery runs were closely related.
Removing all correlated variables would simplify the model but eliminate tactical detail.
Keeping them as independent components would create the opposite problem: dimensions represented by more variables would receive more influence simply because they had more measurements.
The solution was hierarchical.
Related variables were combined into five subindices. The global score was then constructed from those subindices rather than from a flat sum of all metrics.
This preserves detail without counting the same behaviour several times.
4. Weighting
Each subindex was weighted according to its positive correlation with points.
| Subindex | Weight |
|---|---|
| Pressure Effectiveness | 28.3% |
| Recovery Height | 23.3% |
| General Recovery Running | 20.7% |
| Transition Defence | 14.9% |
| Recovery Pressures | 12.8% |
The global value was calculated as:Global Indexi=d=1∑5Wd×Sid
where:
- Wd is the weight of each dimension;
- Sid is the team’s 0–100 score in that dimension.
Within multidimensional subindices, internal weights were distributed according to the positive relationship of each metric with points.
The final score was then rescaled between 0 and 100.
The ranking matters less than the profile
FC Barcelona: strength across the full post-loss sequence
Barcelona score highly in every dimension:
- Pressure Effectiveness: 100
- Recovery Height: 82
- General Recovery Running: 100
- Transition Defence: 82
- Recovery Pressures: 94
The profile suggests more than high pressing.
Barcelona combine:
- effective pressure;
- high recovery locations;
- intense recovery support;
- strong transition response;
- frequent backward pressure.
The volume metrics were adjusted for time without possession. The profile therefore reflects what Barcelona do during the periods in which they actually defend, not simply their total defensive workload.
Elche CF: strong transition response, low recovery height
Elche rank third despite a very low recovery-height score:
- Pressure Effectiveness: 81
- Recovery Height: 10
- General Recovery Running: 74
- Transition Defence: 100
- Recovery Pressures: 89
Their position comes from defensive reaction rather than territorial recovery.
Elche stand out through:
- transition defence;
- backward pressure;
- recovery running;
- pressure effectiveness.
This is a very different route to a similar global score.
For a coach, the relevant questions are:
- Is the deeper recovery height intentional?
- Is the team prepared to defend longer transitions?
- Does the profile reflect strategy or excessive exposure?
- Could the same defensive effectiveness be maintained while recovering higher?
Athletic Club: territorial recovery as the main strength
Athletic Club lead the league in recovery height:
- Pressure Effectiveness: 60
- Recovery Height: 100
- General Recovery Running: 54
- Transition Defence: 55
- Recovery Pressures: 36
Their profile suggests that territorial control may reduce the need for repeated emergency recovery actions.
This illustrates a key point:
A lower value in recovery running is not necessarily a weakness if the team prevents those situations from developing.
Rayo Vallecano: backward pressure as a defining behaviour
Rayo obtain the highest Recovery Pressures score:
- Pressure Effectiveness: 67
- Recovery Height: 16
- General Recovery Running: 60
- Transition Defence: 38
- Recovery Pressures: 98
This suggests a team highly active when pressuring the ball while retreating.
However, the lower recovery height indicates that these pressures may often occur after the opponent has already progressed.
A useful video review would examine:
- where the first pressure begins;
- whether it stops progression or only delays it;
- whether teammates close the spaces around the action;
- what happens after the opponent escapes the first pressure.
Levante UD: more pressing is not always the answer
Levante’s profile is uneven:
- Pressure Effectiveness: 0
- Recovery Height: 40
- General Recovery Running: 36
- Transition Defence: 52
- Recovery Pressures: 25
The largest weakness is not the absence of defensive activity, but the low proportion of pressures that lead to recovery.
The appropriate response would not simply be to press more.
The coaching questions are more specific:
- Are the pressing triggers correct?
- Does the first defender arrive on time?
- Is the opponent being directed towards a predictable area?
- Are nearby passing options controlled?
- Is the team compact enough to contest the next ball?
More volume cannot solve a coordination problem.
How can a coach use the index?
Identify the preferred post-loss mechanism
The subindices reveal whether the team mainly relies on:
- immediate pressure;
- high recovery;
- backward pressure;
- recovery running;
- transition defence.
This helps describe the team’s post-loss identity.
Compare intention with execution
A team may intend to counterpress immediately. The data can show whether that intention produces:
- effective recoveries;
- high recovery locations;
- repeated backward running;
- emergency transition defence.
The tactical idea and its physical consequence can therefore be analysed together.
Connect attacking structure with defensive cost
Post-loss defence begins before possession is lost.
It depends on:
- rest-defence positioning;
- distances between lines;
- occupation of central spaces;
- orientation of nearby players;
- number of players behind or around the ball;
- quality and risk of the pass attempted.
High recovery-running demands may not be solved by improving fitness. The real solution may lie in improving the attacking structure before the loss.
Select the right video clips
The subindices can guide video analysis:
- low Pressure Effectiveness → failed pressing sequences;
- low Recovery Height → reasons for deeper regains;
- high Transition Defence → capacity or excessive exposure;
- high Recovery Pressures → delay versus actual control;
- high General Recovery Running → quality and direction of support runs.
The data identifies where to look. Video explains why.
Limitations and validation
The index should not be interpreted as a complete defensive-performance model.
It does not directly control for:
- opposition quality;
- match status;
- score effects;
- location and type of ball loss;
- number of players ahead of the ball;
- quality of the opponent’s transition;
- whether pressure prevented progression without producing recovery;
- whether the sequence ended in a shot or dangerous entry.
It also does not establish causality.
The weighting reflects relationships with points, but increasing a metric does not automatically increase performance.
A further validation stage would strengthen the model. Relevant external criteria could include:
- opposition transitions ending in shots;
- recoveries in advanced zones;
- progression prevented after loss;
- expected threat generated after recovery;
- video-coded success of post-loss actions.
Until then, the index should be understood as a structured descriptive model of post-loss behaviour associated with performance, not as a definitive measure of defensive quality.
Final interpretation
The most useful question is not:
Which team ranks first?
It is:
How does each team try to regain control after losing the ball—and what happens when its preferred response fails?
The global index summarises the answer.
The subindices explain it.
A team may recover immediately. It may recover high. It may delay the opponent while retreating. It may rely on high-intensity running to repair its structure. Or it may combine several mechanisms.
The model does not attempt to prove that one number explains football.
Its purpose is to generate better football questions.
And although it does not seek to explain Spain’s World Cup performance, it offers a useful framework for one of the tactical issues repeatedly raised throughout the tournament:
What happens when possession is lost?
Possession tells us how a team attacks. Its response after losing the ball may tell us whether that attack is sustainable.