
05 Ago xPPDA: Rethinking Pressure in Football with a Dynamic, Context-Aware Metric
In the world of football analytics, few metrics have gained as much traction—and as many misconceptions—as PPDA (Passes Allowed Per Defensive Action). Widely used to quantify high pressing, the traditional PPDA counts how many passes an opponent completes in certain areas of the pitch before your team applies defensive pressure.
But what if we told you this model—while helpful—is inherently flawed?
Welcome to xPPDA: Expected PPDA Disruption. A next-generation model developed by the Football Intelligence & Performance Area of LALIGA, designed to truly measure pressure. Not by counting arbitrary actions in arbitrary zones, but by dynamically adapting to where the game is actually being played, who is applying the pressure, how oriented they are, and—crucially—what threats they are neutralizing.
Let’s break it down.
Why Traditional PPDA Falls Short
Classic PPDA relies on static pitch zones (e.g. the first 60% of the field or the middle and defensive thirds) to define “pressure areas.” While this may sound reasonable, it completely ignores how teams actually behave tactically.
- A team defending with a high line could appear to have a perfect PPDA simply because no passes are being attempted in the traditional zone.
- A team sitting in a deep block might allow hundreds of passes in areas not considered by the PPDA, making them appear passive when they’re simply choosing their ground.
The problem? We’re measuring pressure in zones where the game isn’t happening.
Introducing xPPDA: Pressure, Redefined
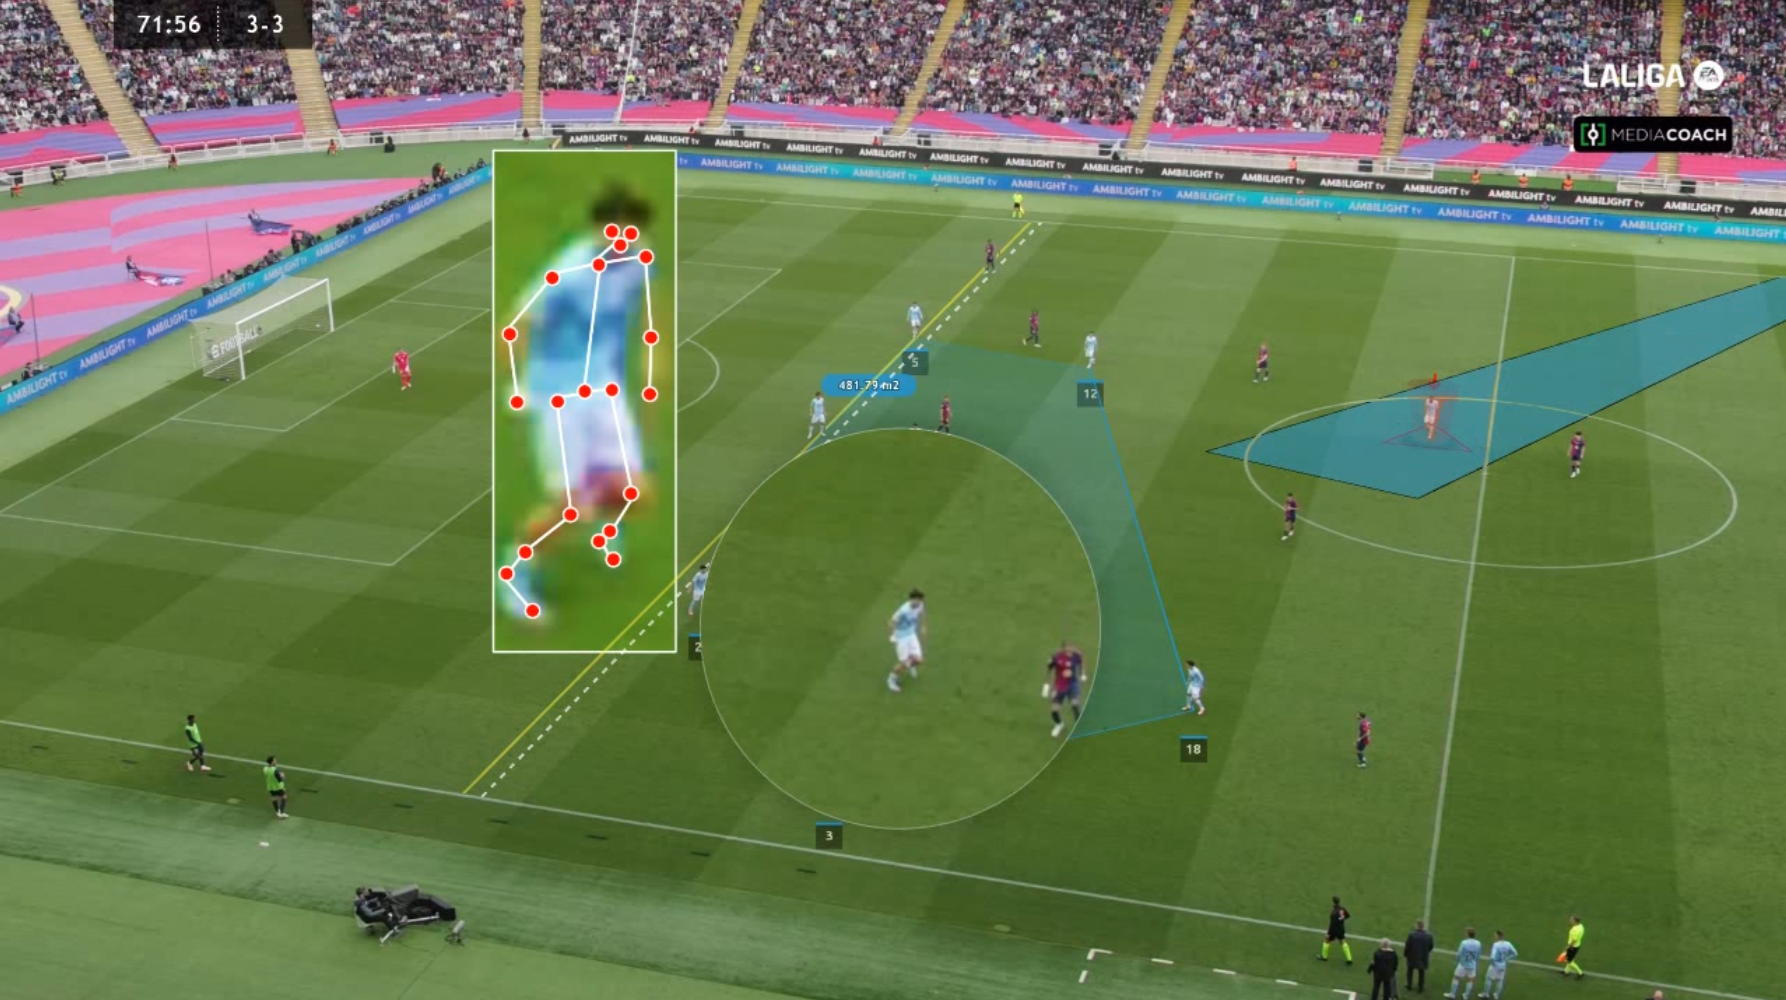
xPPDA (Expected PPDA Disruption) replaces these outdated static zones with something smarter: a dynamic convex hull that adapts to your team’s real-time defensive shape.
This hull is recalculated frame by frame, and includes only the players forming the defensive and midfield lines. Forwards, especially those positioned high to stretch the opposition or remain as outlets in transitions, are excluded from the defensive block. This gives a much more accurate representation of where pressure can actually occur.
What xPPDA Actually Measures
At its core, xPPDA measures the disruption of dangerous passes within this dynamic pressure zone, combining multiple advanced layers:
- Dynamic Pressure Area
- Defined by the real-time convex hull of defenders and midfielders.
- Updated frame by frame with tracking data.
- Pass Inclusion Criteria
- Only passes that are initiated or received within the dynamic pressure zone are considered.
- Passes that merely cross the zone are excluded.
- Pass Threat Value (xPassThreat)
- Each pass is scored based on its potential danger, using a model similar to xG.
- Breaking lines, bypassing compact zones, or targeting the blindside of defenders boosts this value.
- Pressure Intensity
- A pass is only considered “disrupted” if a defender is within 2 meters at the moment of execution or reception.
- For high-pressure situations, this threshold drops to 1 meter.
- Thanks to skeletor tracking data, player orientation is also factored: defenders must be facing the ball carrier or recipient to count as exerting real pressure.
- Alternative Pass Scenarios
- Our model simulates what would have happened if the ball carrier had selected another passing option.
- Intercepting a pass becomes more valuable when the alternative was even more dangerous.
- Normalization & Contextual Adjustments
- xPPDA is normalized per minute of opponent possession, making it fair across different playing styles.
- The proportion of long passes vs short/medium is also used to adjust the metric to reflect teams that deliberately bypass pressure.
What xPPDA Really Tells Us
This model doesn’t just count how many defensive actions your team makes. It tells you:
- Where and when your team applies meaningful pressure.
- How effective that pressure is in stopping dangerous plays.
- Whether your pressing disrupts the opponent’s buildup or merely follows it.
- How much value you generate by preventing specific threats, not just reacting to them.
In short, xPPDA is not a volume-based metric—it’s a contextual, tactical, and anticipatory metric.
Built for Practitioners, Powered by Science
xPPDA isn’t just a back-office analytical tool. It’s fully integrated into LALIGA’s tactical camera system, offering:
- Auto-generated visual overlays of the pressure hull per frame
- Real-time alerts on defensive disorder (e.g., players out of block)
- Visuals of pressure intensity zones
- Clip tagging for dangerous passes disrupted
This allows coaches, analysts, and performance staff to not only quantify pressure, but also teach it, train it, and tactically adjust it.
The Future of Pressing Analysis
The game is evolving. So should our metrics.
With xPPDA, we move from counting defensive actions to valuing defensive intelligence. From arbitrary zones to live tactical geometry. From theoretical pressure to pressure that truly matters.
If you’re a coach looking to fine-tune your pressing system, an analyst building smarter opposition reports, or simply a football mind hungry for better tools—xPPDA is the metric you’ve been waiting for.